
AT40 = 9.4% of stocks are trading above their respective 40-day moving averages (DMAs) (oversold day #4, 35-month low!)
AT200 = 12.8% of stocks are trading above their respective 200DMAs (new 34-month low)
VIX = 28.4 (10-month high, intraday high at 30.3)
Short-term Trading Call: bullish (caveats below!)
Commentary
The plunge continues.
AT40 (T2108), the percentage of stocks trading above their respective 40DMAs, ended the day at a 35-month low. It finally cleared all the earlier oversold periods of 2018 and reached all the way back to the pain of late 2015. This oversold period is now 4 days old but it feels like it has lasted for weeks and weeks.
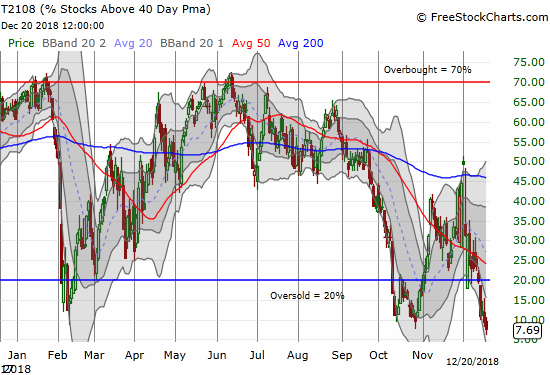
AT40 (T2108) continued its plunge. The 7.7% surpassed the closing lows of all 2018’s earlier oversold periods and hit a 35-month low.
AT200 (T2107), the percentage of stocks trading above their respective 200DMAs, also continued its plunge but stayed out of single digits. At 12.8% it trades at a fresh 34-month low.
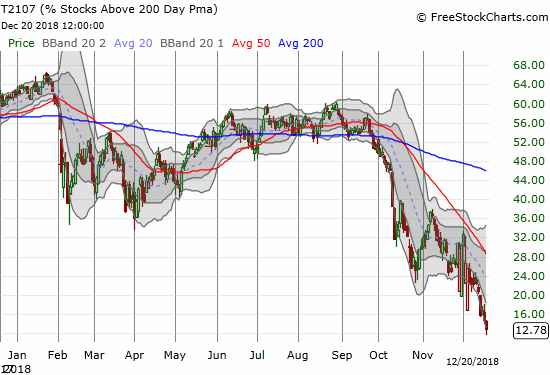
AT200 (T2107) dropped to 12.8% and finished at a new 34-month low.
As a reminder, the level of these breadth indicators no longer matter. They are so low that they cannot go much lower. Moves lower do not even say anything about rates of change. The technical damage is so brutal that a vast swath of stocks are tumbling in short to medium term downtrends. I am bullish only in anticipation of the inevitable bounce, but the rally will likely serve as another opportunity for slower hands to dump their inventory of stocks and ETFs. (See “A Fed Undeterred Is A Stock Market Not Yet Low Enough” for a more expansive description).
The S&P 500 (SPY (NYSE:SPY)) gapped down but rallied quickly to close the gap. The index was mostly downhill from there for a 15-month low.
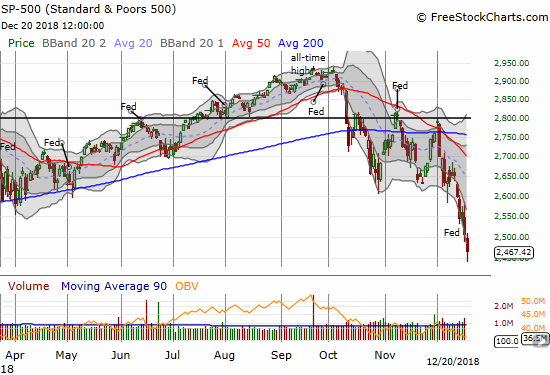
The S&P 500 (SPY) lost another 1.6% for a 15-month low.
The NASDAQ Composite and the Invesco QQQ Trust (NASDAQ:QQQ) sold off for 1.6% and 1.5% losses and 14 and 15-month lows respectively.
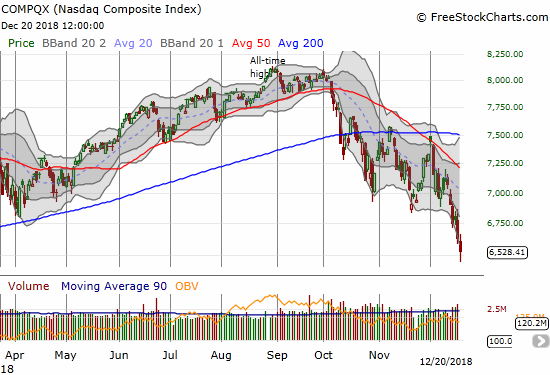 The NASDAQ lost 1.6% for a 14-month low.
 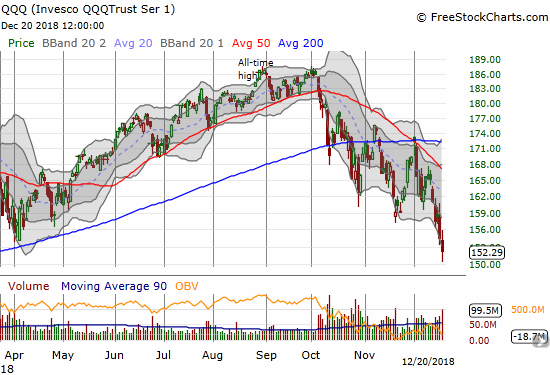 The Invesco QQQ Trust (QQQ) lost 1.5% and closed at a 13-month low.
The iShares Russell 2000 ETF (NYSE:IWM) reached a very important low. The 2-year low brings the index of small cap stocks within sniffing range of a complete reversal of its post-election gains. The day after the U.S. Presidential election IWM surged for a 3.8% gain and a close of 122.54. IWM has gone from an astounding 41.2% gain since that close at its last all-time high to a mere 7.5% gain. That plunged occurred in less than 4 months.
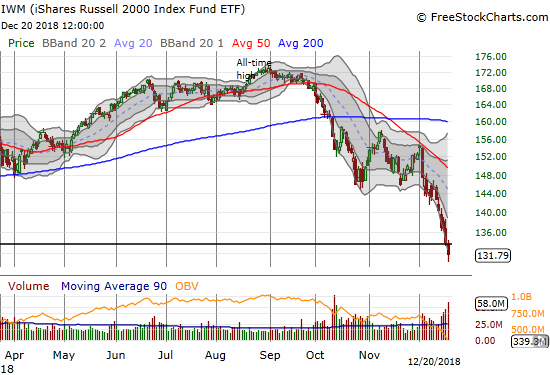
The iShares Russell 2000 ETF (IWM) continued an unabated plunge to a 2-year low.
The volatility index, the VIX, provided one “bright” spot for the oversold period. It finally showed a relatively greater level of fear; it is the kind of higher volatility I would expect for a sell-off which is worse and more back-breaking than the other sell-offs of 2018. The VIX finally punched through 26 and even hit 30.
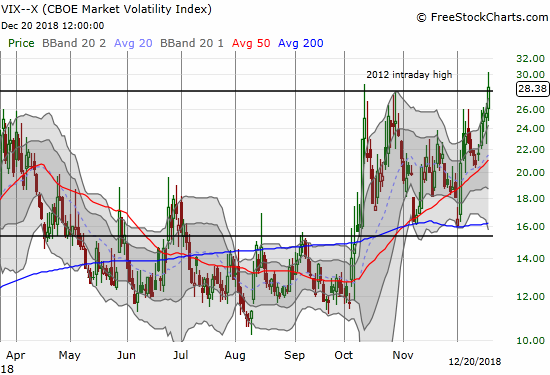
The volatility index, the VIX, finally broke through the 26 barrier and even hit 30 at one point. The VIX closed with an 8.8% gain.
The small incremental spike in the VIX was my fresh signal to take profits on most of my remaining hedges (gulp!) and to do a little more nibbling on long positions. For example, I bought some puts in ProShares Ultra VIX Short-Term Futures (NYSE:UVXY). I held on buying SPY call options because I already own ProShares Ultra S&P500 (NYSE:SSO). I am thus in no rush. I might add more shares, but I will wait on the calls until I see some evidence of buying interest…or of course if the market delivers a truly outsized spike in the VIX, like a 20%+ 1-day gain.
CHART REVIEWS
Carnival Cruise (NYSE:CCL)
CCL reported earnings and delivered all sorts of bad news. This post-earnings plunge is a classic example of how a company can confidently report on the strength of its business and its accompanying business environment…until it is suddenly not so strong.
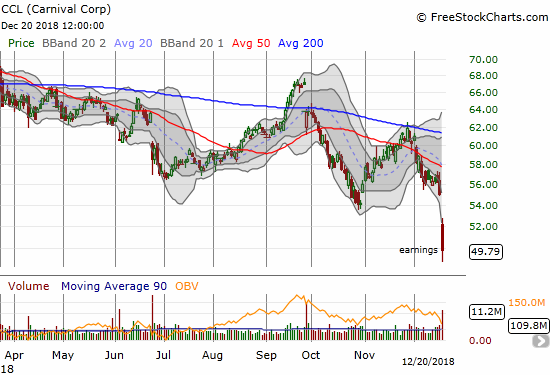
Carnival Corporation (CCL) plunged 9.5% post-earnings for a 25-month low.
Conagra (NYSE:CAG)
CAG was a shocker. The earnings report was full of pointers to hurricane-related impacts. If hurricanes and other one-off effects were truly at play here, then CAG just became a major buy. I am keeping my eye on this one (and I need to read the earnings report more closely soon).
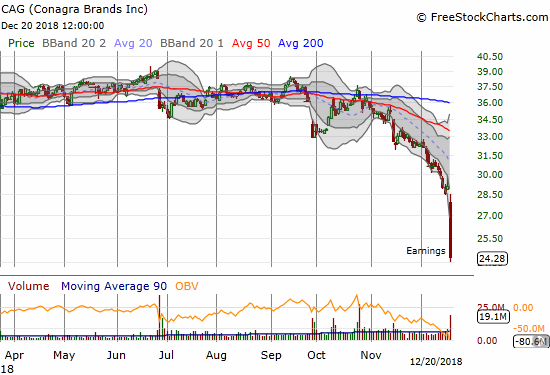
Conagra Brands (CAG) imploded for a 16.5% post-earnings loss and a 4-year 4-month low.
SPDR Gold Shares (NYSE:GLD)
I was prepared to see GLD breakout above 200DMA resistance on the heels of a capitulated Fed. It took a day, but the breakout is finally here. I may have a tricky decision on Friday as my calendar call spread pivots on the $119 strike with the short side expiring now. I may just take profits and look next week to make a fresh (long) trade.
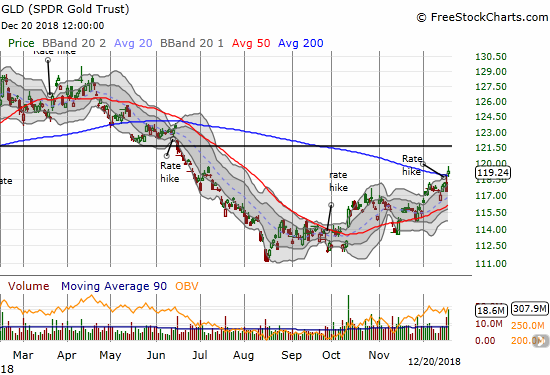
The SPDR Gold Trust (P:GLD) broke out above its 200DMA with a 1.5% gain.
“Above the 40” uses the percentage of stocks trading above their respective 40-day moving averages (DMAs) to assess the technical health of the stock market and to identify extremes in market sentiment that are likely to reverse. Abbreviated as AT40, Above the 40 is an alternative label for “T2108” which was created by Worden. Learn more about T2108 on my T2108 Resource Page. AT200, or T2107, measures the percentage of stocks trading above their respective 200DMAs.
Active AT40 (T2108) periods: Day #4 under 20% (4th oversold day), Day #7 under 30%, Day #9 under 40%, Day #59 under 50%, Day #75 under 60%, Day #128 under 70%
Daily AT40 (T2108)")
Black line: AT40 (T2108) (% measured on the right)
Red line: Overbought threshold (70%); Blue line: Oversold threshold (20%)
Weekly AT40 (T2108)
Be careful out there!
Full disclosure: long SSO, long SPY call options, long GLD shares and calendar call spread