US stocks rally for second week after healthy correction
Treasury yields ease but remain at 4-year high, suggesting investor readjustment
Bond trader doubts over Fed hawkishness drive dollar selloff
Gold benefits from dollar weakness
Ruble set to advance on boosted Russian credit score
Oil pressured at 3-week high
Bitcoin falls for a third day, slips below $9,500
- As a commodity, it is priced in dollars; a strong dollar renders gold more expensive whereas a weak dollar makes it cheaper
- Gold provides no yield, unlike interest rates and the USD; therefore, when the outlook for interest rates shifts, so does the supply-demand balance of gold; and, finally,
- Gold, unlike the riskiness of the dollar, provides safe haven status—except during times of significant global turmoil, like that of the 2008 financial crisis.
ECB President Mario Draghi speaks in Brussels on Monday.
Bank of Korea reveals its monetary policy decision on Tuesday.
Powell testifies before a House panel on Tuesday, discussing the Fed’s Semi-Annual Monetary Policy Report and the state of the economy. He returns on March 1 to testify before a Senate committee.
U.K. Prime Minister Theresa May delivers a speech on Britain’s relationship with the European Union after Brexit.
A barrage of data is expected out of Japan including retail sales and industrial production on Wednesday, and capital spending on Thursday.
In China, the official manufacturing and non-manufacturing PMIs on Wednesday as well as the Caixin Manufacturing PMI on Thursday may show growth momentum slowed slightly in February, though results may have been altered by recent holidays.
The STOXX Europe 600 Index gained 0.7 percent as of 8:12 a.m. London time (3:12 EST), the highest level in more than three weeks on the largest rise in more than a week.
Germany’s DAX Index gained 0.8 percent to the highest level in almost three weeks.
The MSCI All-Country World Equity Index climbed 0.4 percent to the highest level in more than three weeks.
The dollar Index declined 0.25 percent to 89.66, after rising 0.1 percent to 89.99, the lowest level since last Tuesday.
The euro increased 0.3 percent to $1.2329.
The Japanese yen climbed 0.3 percent to 106.62 per dollar, the strongest level in a week.
The British pound increased 0.5 percent to $1.4038, the strongest in more than a week on the largest climb in more than a week.
The Russian ruble rose 0.4 percent to 55.881 per dollar, the strongest in 10 months.
The yield on 10-year Treasuries was little changed at 2.86 percent.
Germany’s 10-year yield was steady at 0.65 percent.
WTI crude held at $63.58 a barrel.
Gold climbed 0.8 percent to $1,339.51 an ounce, the highest in a week on the biggest increase in more than a week.
Key Events
Friday saw US equities rebound to save the week from closing in the red, even posting small gains across all four major indices—the S&P 500 Index, the Dow Jones Industrial Average, NASDAQ Composite and Russell 2000. This minor advance built on the rally of February 9-15, which marked the strongest 5-day performance for US equities in 5 years.
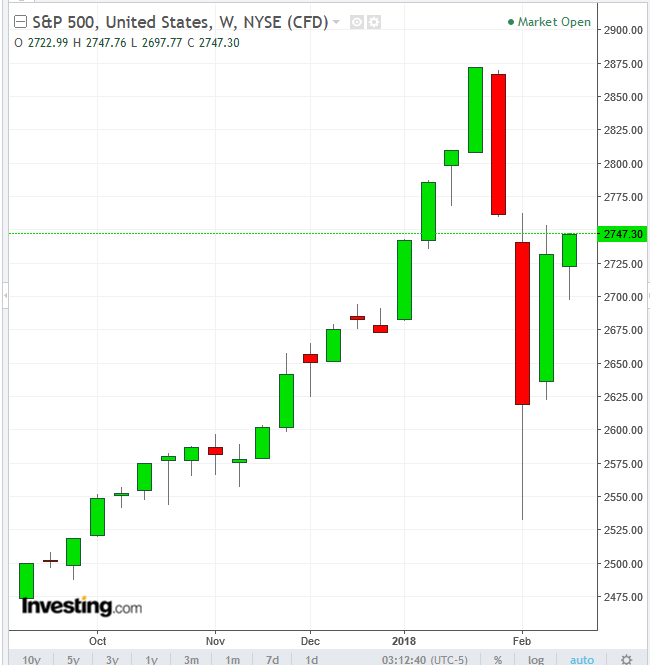
Still, the bounce back fell short of recouping all losses incurred during the worst two-week plunge in two years which preceded the current rally. That drop also saw the S&P 500 losing nearly 12 percent in value. While the equity plunge may have been bad for traders holding long positions, it was good for the market as it represented an extremely overdue correction, to sustain a market that has reawakened the so-called animal spirit.
Global Financial Affairs
This morning stocks advanced across the board in Asia—from Sydney's S&P/ASX 200 to Hong Kong's Hang Seng—building on Friday’s US gains to extend a two-week global rally. European shares followed in the footsteps of their Asian counterparts.
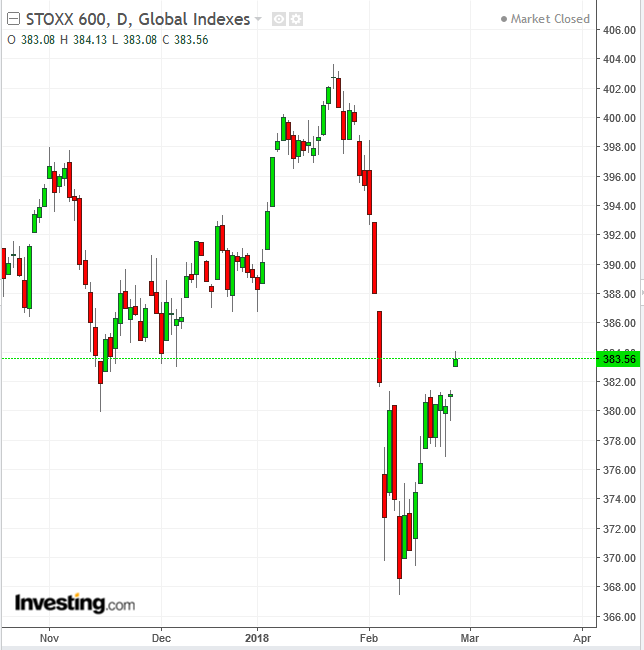
The Europe STOXX 600 Index jumped to its highest level in more than three weeks as all major industry groups rallied. Technically, the price provided an upside breakaway gap, a bullish move, with the gap-bottom providing a support.
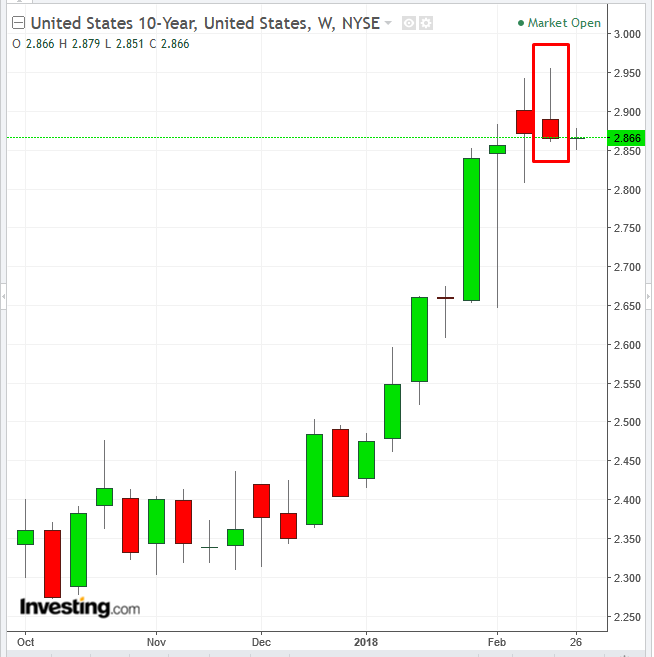
Treasurys steadied, after retreating from almost 2.96 to 2.86—yields are still at a 4-year high, but the current calm may indicate investors have readjusted to the current equity market levels—suggesting they might rotate back into stocks. Technically, the 10-year Treasury yield formed a bearish Shooting Star, suggesting an oncoming decline, signaling renewed demand for Treasurys.
Meanwhile, bond traders are pricing in less than the three quarter-point rate hikes that policy makers have repeatedly signaled they are likely to execute this year. Since the January 29-February 9 equity selloff, which was said to have been caused by surging Treasury yields toward the 3-percent mark, many analysts and traders have argued that stocks have another 3.5 percent to 4 percent room for growth.
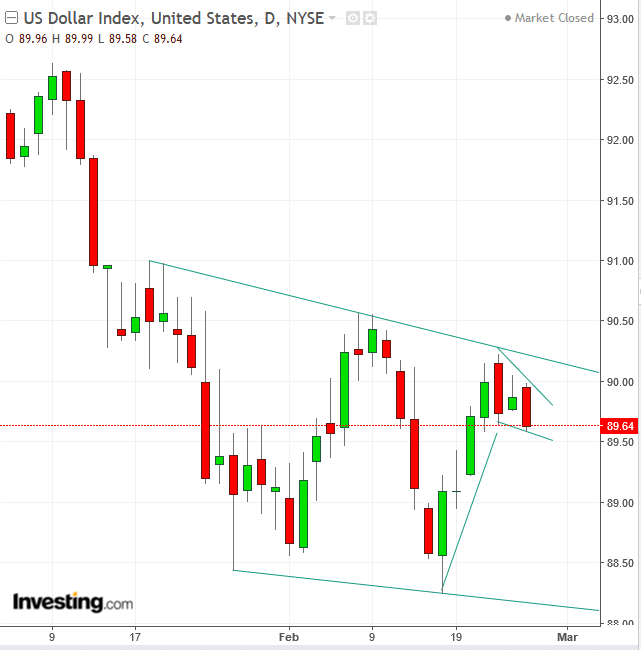
The dollar slipped against most major currencies this morning as investor focus returns to U.S. monetary policy, with two appearances by Federal Reserve Chairman Jerome Powell coming up this week: before the House Financial Services Committee on Tuesday and before the Senate Banking Committee on Thursday, for the usual semiannual monetary policy testimony.
Declining Treasury yields may have pulled down the dollar, as Treasurys now attract that much less foreign investment, which would require a dollar purchase.
Technically, the drop in the dollar occurs beneath a falling trend line since January 18. However, it may be forming a bullish Falling Flag at the same time. At this point, it is impossible to tell whether today’s decline should be viewed as bearish—a confirmation of the oversupply above the falling trendline, and as a validation of the actual decline itself.
Or is it bullish, a profit-taking pattern formed by traders who enjoyed a 2.2 percent rebound from February 16 88.25 low to February 22 90.93 high, as well as by new traders coming into the greenback, having turned bullish on the buck and willing to push prices higher. The direction of the breakout will most likely determine the next 2-percent move.
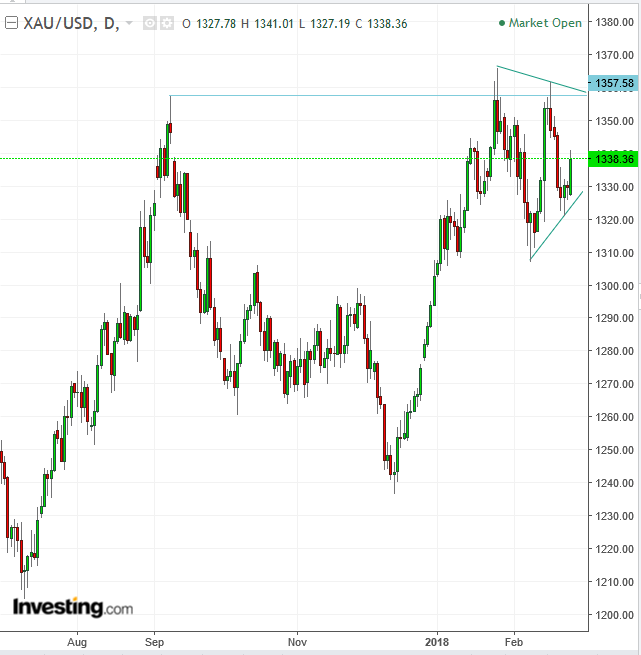
As a sounding board, the price of gold maintains a negative correlation to the dollar for three reasons:
Technically, the price of gold is forming a symmetrical triangle. While its symmetry implies equal determination between buyers and sellers, the preceding trail is expected to prevail (although the actual breakout determines the perceived trajectory that follows). Should the trading dynamic proceed as expected, it will also have registered a peak higher than its former $1,357.58 high of September 8—another signal for a resumption of the uptrend.
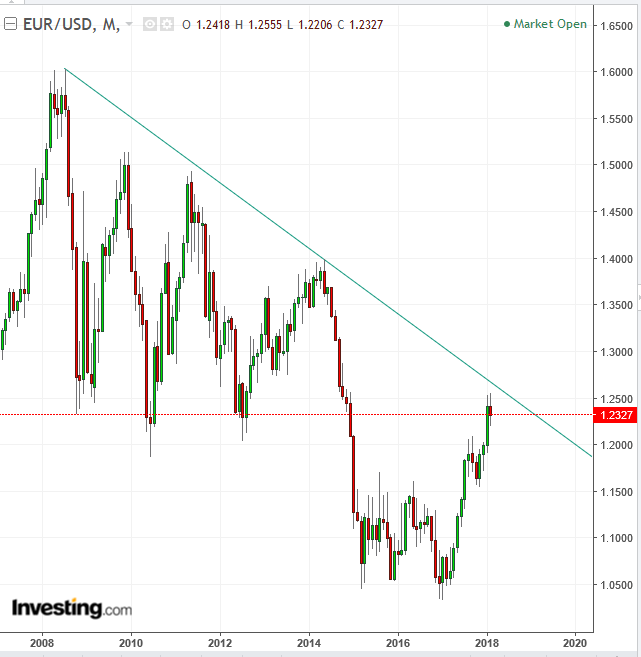
The euro is expected to rise in 2018 on the back of the eurozone's forecast 2.3 percent GDP growth and the European Central Bank’s expected unwinding of its gargantuan balance sheet. However, the ECB faces a quandary. Its main target is to keep prices stable, while a stronger euro could potentially hurt the bank’s inflation target, forcing it to reevaluate its monetary policy.
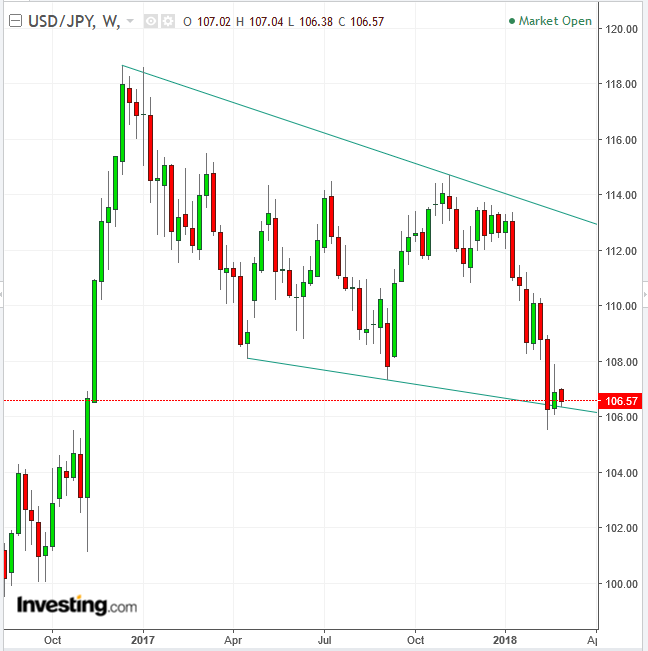
The yen reached a one-week high as Bank of Japan Governor Haruhiko Kuroda said the central bank has no plan to revert its current path of quantitative easing. Technically, the USD/JPY pair is retesting the lower bound of a falling channel, the penetration of which may suggest a steeper decline to follow, towards the 100.00 level.
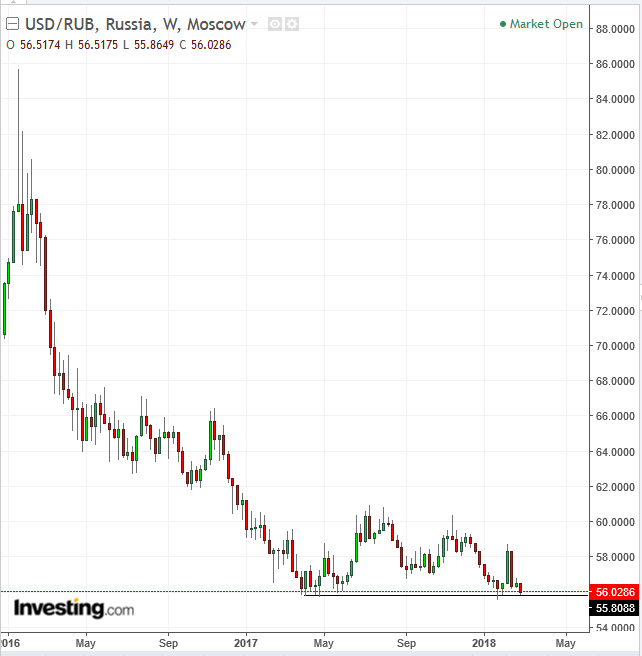
The ruble appreciated the most among emerging market currencies after S&P Global Ratings boosted Russia's credit score to investment grade. Technically, A close below 55.80 may suggest another 8-percent decline.
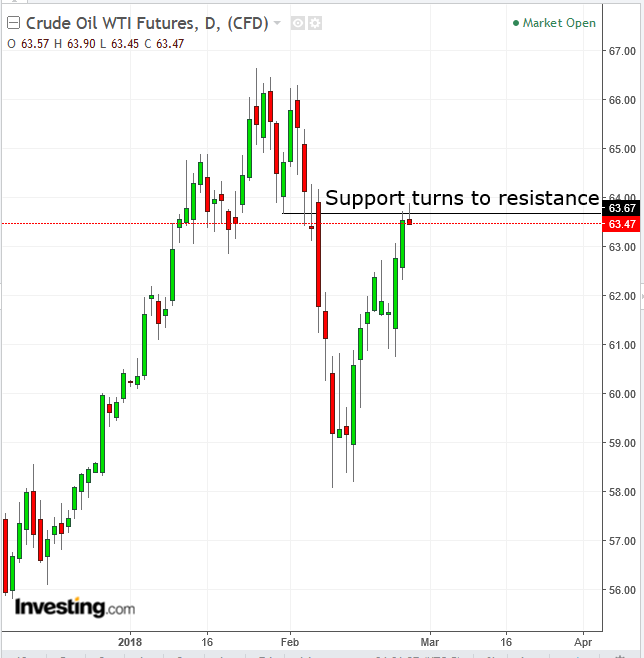
The price of oil reached a near three-week high. However, despite comments from top oil exporter Saudi Arabia that it would continue to curb shipments, in line with the OPEC-led effort to cut global supplies, the price then retreated below $63.50, from its earlier high of nearly $64.00.
Technically, that forms a bearish Shooting Star, which may signal that there still is oversupply left from the late January-early February congestion that preceded the near-9 percent decline from the current mid-$63 levels to the $58 levels.
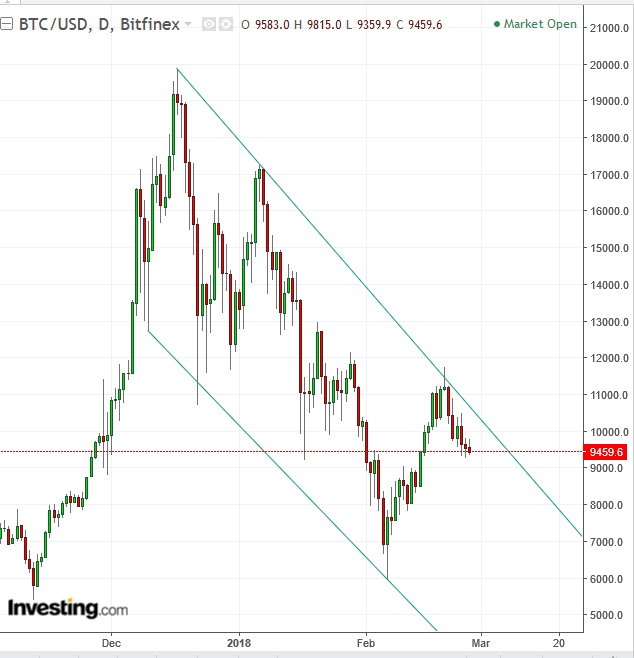
Bitcoin is extending its decline to a third day, falling below the $9,500 level.
Up Ahead
Market Moves
Stocks
Currencies
Bonds
Commodities
