Right now would be a very good time to have Sammy Hagar as your co-pilot. While there have been several areas of the markets to have grabbed big gains this year, there is still plenty to worry about. I love the NASDAQ stock gains, but I also squirm when I see how many sectors of the market aren’t participating. If Banks, Consumer Staples and Emerging Markets were participating in this equity market, I would consider removing my portfolio’s brake for a second gas pedal. But with economic uncertainty building, credit worsening and interest rates rising, I want to make sure that every turn I make is near perfect.
For a month in July this is a busy week in the markets: Trump/Putin summit, Fed Chairman Powell testifies before Congress, plenty of China data to look at, 18% of the S&P 500 will release earnings, and of course Amazon (NASDAQ:AMZN) Prime day to worry all retailers. Oil markets also must look for follow-through comments regarding the White House tapping the strategic petroleum reserve to try and lower oil prices. (I’d suggest saving the tap for a recession, depression, or if prices spike > $200 a barrel during a global shock.)
Lots of talk about the market breadth this week. Yes, the total market breadth is wide given how strong small caps have done with the stronger U.S. economy and the fear of trade wars. But also no, the major cap-weighted indexes are narrow as the technology-weighted mega caps have put up all the performance for the year. It helps that these mega caps are more service oriented (so less affected by global trade wars) and they also earn sizable profits in the the better performing global economy (the U.S.). So everyone is both right and wrong. Now go look back in time to the last time that both Mega Caps and Small Caps outperformed. Unfortunately, Sammy Hagar did not have a chart topping album during the last three times that this happened. Instead the chart-toppers were Santana’s Supernatural, Nelly’s Nellyville and Rhianna’s Good Girl Gone Bad. And if you don’t want to look up the dates, just call The Leuthold Group in Minneapolis. In the meantime, I am double checking my 5-point seat belt and cinching my helmet.
A strong theme among the all-time new highs last week…
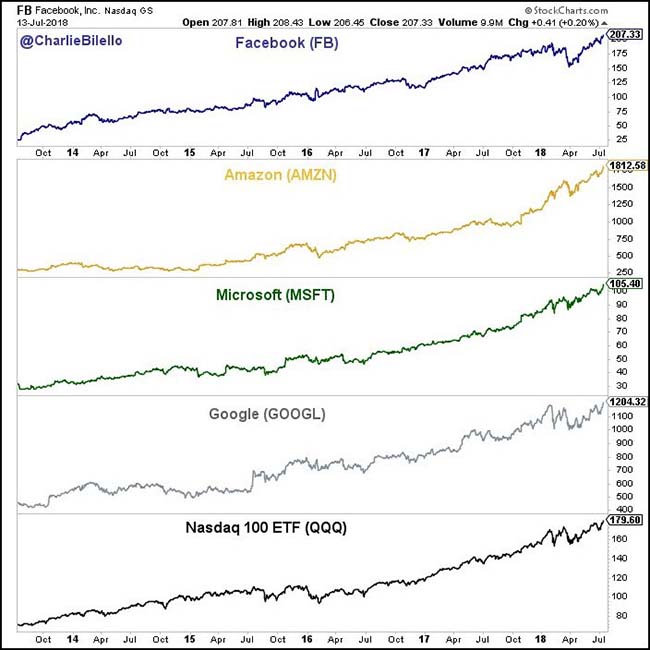
(@charliebilello)
But even as the Nasdaq makes all-time new highs, it has little bench support…
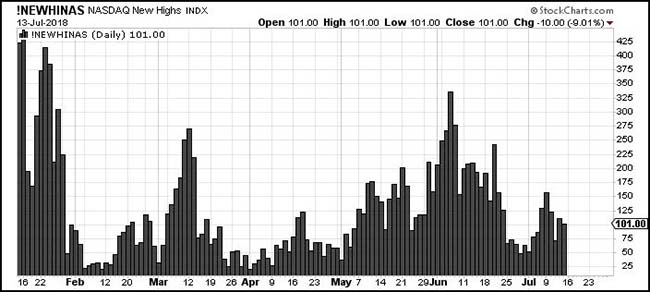
(@hmeisler)
And if you remove the FANG stocks from the S&P 500, you are seeing red…
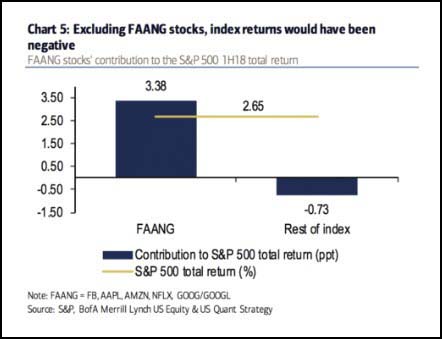
(Bank of America/Merrill Lynch)
Most broadly, the NYSE breadth looks very strong…
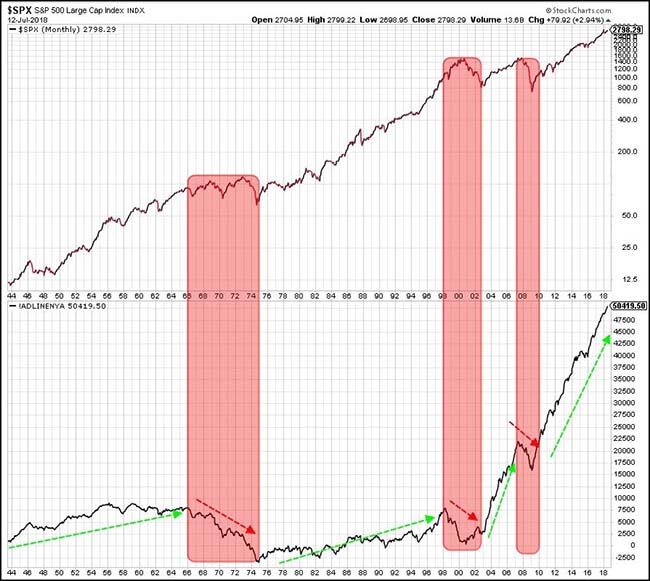
(@RyanDetrick)
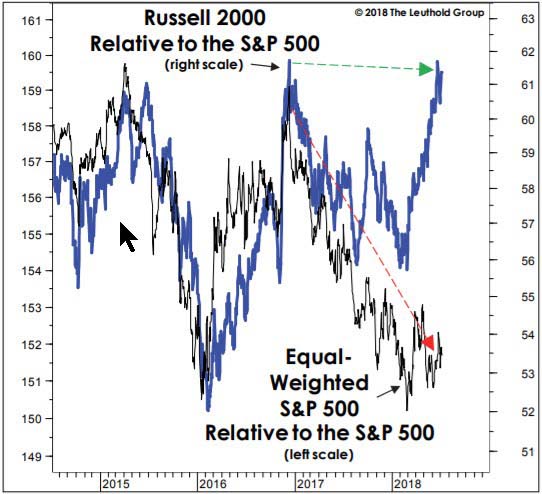
Helped by the Small Cap Russell 2000 stocks…
While the smaller names in the S&P 500 are a drag in the index.
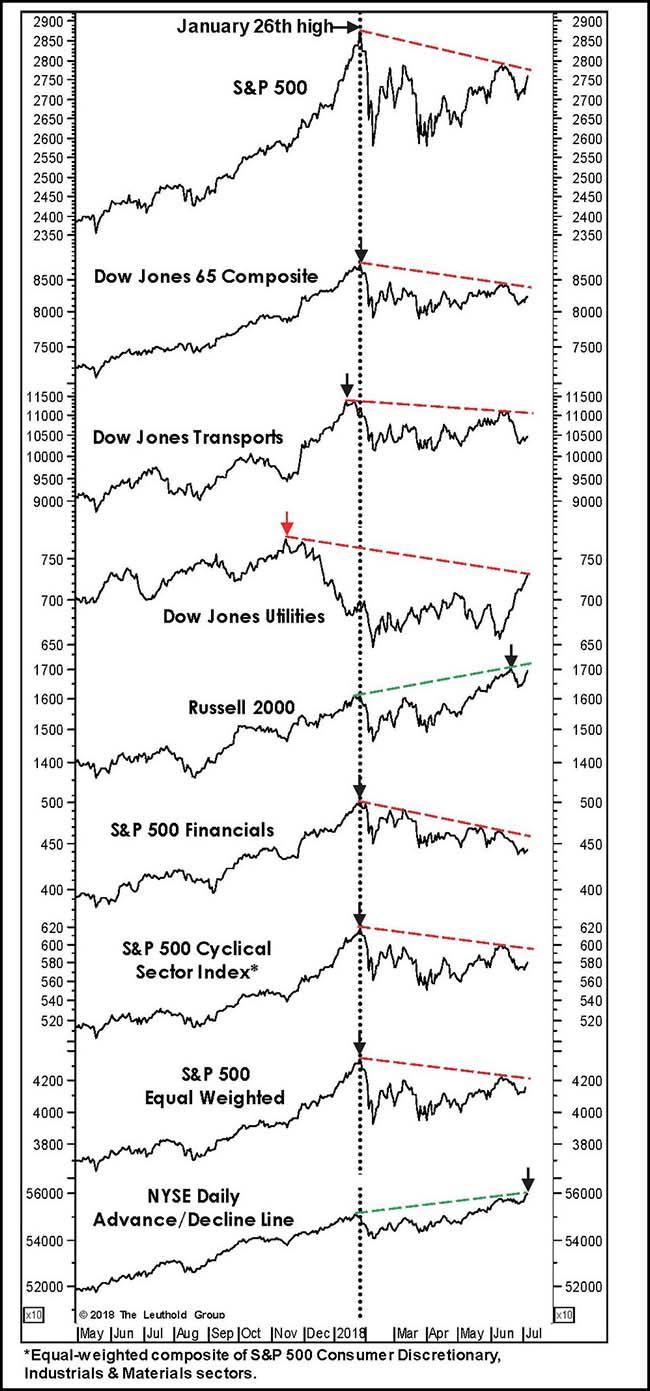
This chart sums up the current market well…
@LeutholdGroup: Is the disjointed StockMarket Bullish or Bearish? Only two key bellwethers have seen new highs since January (bearish?); but, one of those (NYSE Daily Advance/Decline Line) is a better short-term forecaster (bullish?).
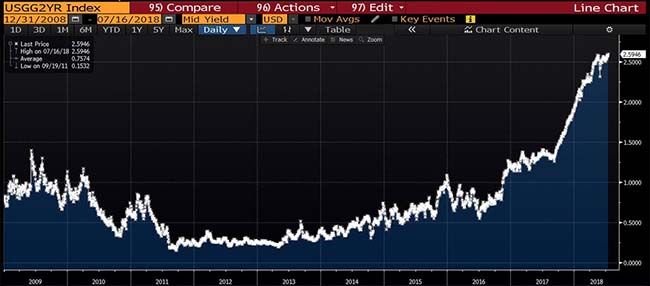
Meanwhile, two year yields hit a post crisis high…
2.59% is better than nothing if you are fresh out of good ideas.
(@lisaabramowicz1)
Speaking of cash as an investable asset…
“U.S. markets are not in long-term equilibrium,” Greg Jensen, Bridgewater’s co-chief investment officer, said in a telephone interview this week. “We believe the next move is into cash, as we believe stocks and bonds are going to perform poorly over the next 18 months.”
Jensen, who helps oversee roughly $160 billion in assets, said his outlook follows a decade when central bank policies bolstering market liquidity and keeping interest rates low have driven investors to seek out higher returns where they could.
While prolonged easy money policies and economic expansion have bolstered returns from riskier assets, Jensen said they have resulted in lowered current total return prospects.
“It almost looks like in U.S. asset markets that the riskier the asset, the lower the expected return,” he said.
Jensen said cash, whose yield moves in sympathy with U.S. Federal Reserve interest rate hikes, looks attractive for the first time in years as the central bank pursues quantitative tightening.
“Cash has become a viable alternative to (financial) assets on an expected return basis,” he said. “While there is still a lot of cash globally, it is on corporate and bank balance sheets preventing a financial cascade, but U.S. investors have very low cash levels.”
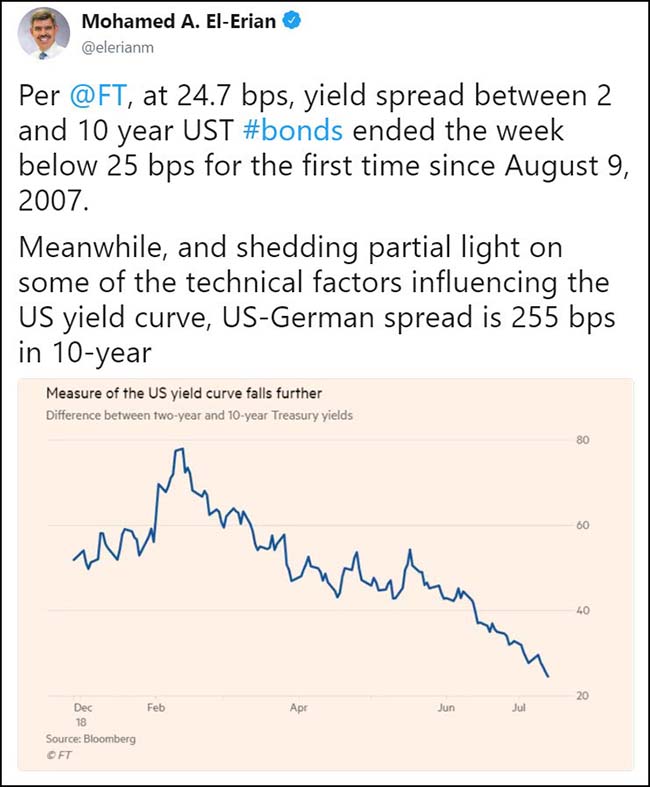
The 10-Year vs. 2-Year yield curve moves to a new low…
Jeffrey Gundlach has some thoughts on the yield curve…
We are getting closer to a recession. When the curve goes flat from the two-year Treasury to the 10-year [meaning that the yields are identical], the recession risk is at least a year away. Recently, that spread was 28 basis points [hundredths of a percentage point], which is pretty close to being flat. It is flashing yellow. It needs to be respected. The other reason to think 2019 might be more problematic is that quantitative tightening has just started. The Fed has started to let bonds roll off its balance sheet [the central bank isn’t buying new bonds when many current holdings mature]. Several billion dollars of bonds per month are coming due, but by October the amount will be up to $50 billion per month.
At the same time, the Fed has said it intends to keep raising interest rates, probably twice more this year. That, together with the signal from the yield curve and perhaps $600 billion of quantitative tightening, and a budget deficit that is growing, is an issue. The strangest thing is that Congress passed a $280 billion tax cut and spending increases so late in the cycle, and with interest rates rising. It’s like a death wish. The U.S. is taking on hundreds of billions of dollars of debt while raising rates, which means our debt-service payments are going to be under serious pressure to the upside.
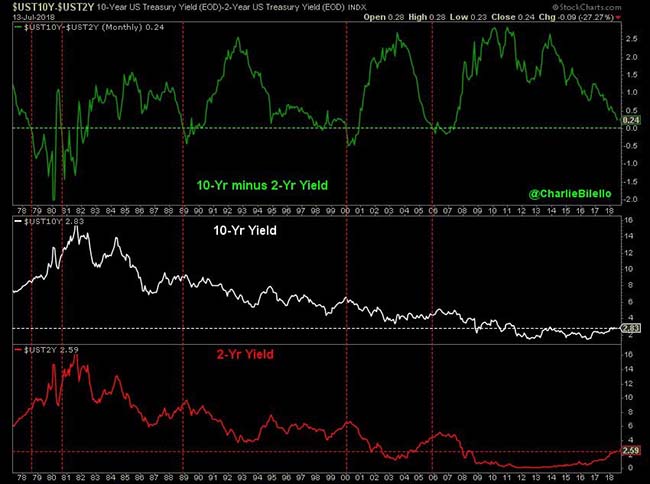
As this chart shows, the last five times the yield curve inverted proved interesting times for the stock market…
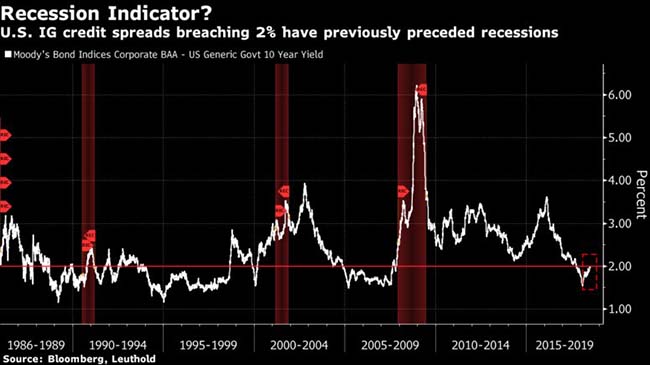
More ink from The Leuthold Group this week worrying about the new trends in credit spreads…
One gauge of recession risk with a “pretty good” track record over the last half century has just raised a cautionary signal, according to the Leuthold Group.
For the first time since just prior to the 2007-2009 recession, premiums on the lowest-rated tranche of investment-grade U.S. corporate bonds have risen to 2 percent after being below that level, according to data compiled by the Minneapolis-based research group. The analysis looks at the gap in yields between corporate debt rated Baa by Moody’s Investors Service and those on 10-year Treasuries.
You cannot predict, but you can prepare. ~ Howard Marks
(@mjekm5)
Scott Black talks about trade and global growth in Barron’s…
Synchronized global growth is over. We all benefited from it last year. The German economy was growing by 2.3% in the fourth quarter. Now, growth has fallen to 1.6%. Germany is the economic linchpin of Europe. The U.S. is growing by an annualized 2.8% or so, but a real trade war between the U.S. and our trading partners could shave 100 basis points [one percentage point] off real gross domestic product next year. Trade issues should have been dealt with through quiet diplomacy, not a public spectacle.
The U.S. dominates in global agriculture. The trade wars are now rewarding its farmers and ranchers with an unfortunate early retirement…
As David Williams looked over the soybean fields of his 3,800-acre farm, he counted the ways he’s had to handle falling commodity prices in recent years: not purchasing new equipment, cutting costs, finding less expensive farming methods.And now that China has implemented 25 percent tit-for-tat tariffs on soybeans and other imports from the United States, the 67-year-old president of the Michigan Soybean Association wonders what that will mean for the future.
“Nobody wins in a trade war,” said Williams, a fifth-generation farmer. “We’re not going to win. China’s not going to win. In the meantime, soybean farmers are just hurting.”
With farm net incomes down nearly 60 percent since 2013, many farmers who supported the president in 2016 are feeling further strain as they face the repercussions of an intensifying trade war. The price of soybeans has plunged 17 percent in the past month. Williams has seen $2 less per bushel of soybeans, about a 20 percent decrease.
“I feel like agriculture has supported the current administration,” Williams said. “I don’t feel that support coming back to us.”
Iowa farmers have no ‘plan B’ for replacing corn and soybean production…
“We are already feeling the brunt of these tariffs in the form of a reduction in the purchase of products that historically we’ve been selling to China for many years now, soybean in particular,” he said on “Power Lunch.”
Last week, China slapped retaliatory tariffs on $34 billion worth of U.S. goods, including soybeans and pork, in response to U.S. duties on $34 billion worth of Chinese goods.
President Donald Trump responded earlier this week by unveiling a list of tariffs on $200 billion in Chinese goods. The duties will not go into effect immediately but will undergo a two-month review process. China then hit back with its own threat of tariffs on $200 billion of U.S. goods.
Naig said that Iowa predominantly produces corn and soybean, so farmers can’t try to come up with a “plan B” by shifting production.
“They’ve spent a lot of time and energy to build this market, particularly China and soybean, and we’d like to see that effort pay dividends, not be wasted,” he said.
China buys about half of the U.S. soybean exports, and roughly one in three rows of soybeans grown on the nation’s farms goes to the world’s second-largest economy, according to the American Soybean Association. Nearly $20 billion in U.S. agricultural exports went to China last year, with more than half of that amount coming from soybeans.
Neither does North Dakota…
Randy Richards considers himself an optimist. After all, the farmer lives near the town of Hope in eastern North Dakota.
But a flurry of trade news in recent months has Richards worried. It reached a crescendo last week, when China imposed retaliatory tariffs on a range of U.S. products, including 25 percent on soybeans, one of the crops Richards grows.
On the other end, the cost of equipment is going up because of previous tariffs President Donald Trump’s administration imposed on steel and aluminum imports, he said. And amid those fights, the Trump administration is renegotiating the 24-year-old trade agreement linking the U.S. with Canada and Mexico.
“I’ve been doing this for 46 years,” said Richards, the Steele County president for the North Dakota Farmers Union. “Right now, I am the most scared I’ve ever been as to where the future of farming is going.”
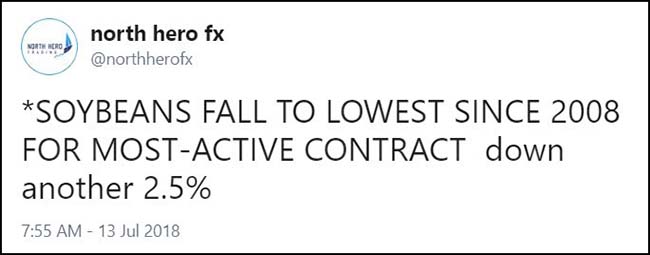
Soybean futures hit record lows on Friday, as the US Department of Agriculture (USDA) slashed its outlook for American farmers in an updated forecast for the year ahead.
According to Xinhua, November soybean futures on the Chicago Board of Trade plunged 60.25 cents weekly, or 6.74 percent.
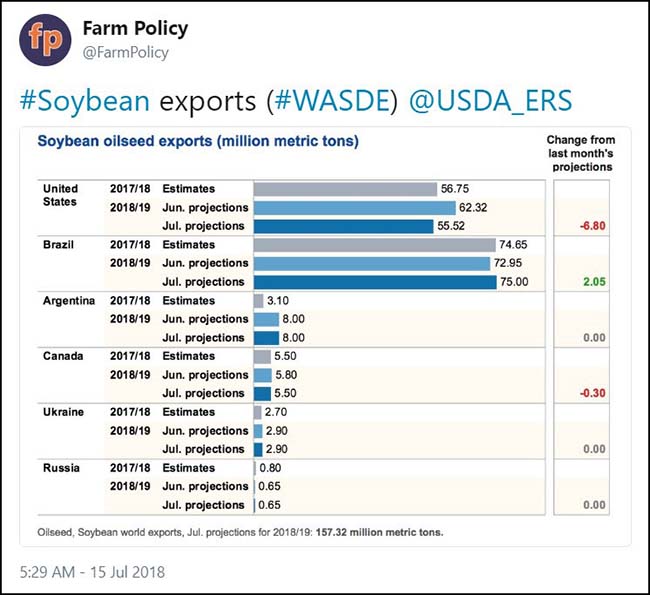
The data came as the USDA released its latest forecast on the sector, predicting a record boost for Brazilian soybean farmers at the expense of the US agricultural sector.
Taking into account the effects of the latest round of US trade tariffs, the USDA in its report expects US soybean exports to fall by 11 percent over the next 12 months, dropping from 62.3 million tons to 55.5 million tons.
The forecast suggests Chinese soybean imports will fall from 103 million to 95 million tons, while Brazilian exports will hit a record high of 75 million tons.
After the US slapped 25 percent tariffs on 34 billion US dollars’ worth of Chinese imports, China responded in kind, in a move that increased duties on US soybean imports by 25 percent…
With demand from China set to drop, US farmers will be forced to stockpile soybean crops. The USDA forecast suggested that stockpiles will increase from 10.5 million tons to 15.8 million tons by the end of the 2018-19 marketing year.
WASDE projections last week show Soybean silos in the U.S. filling up…
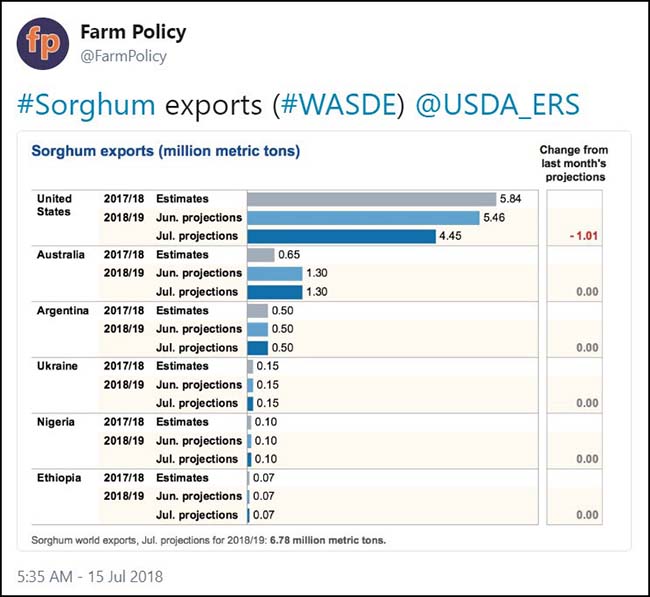
Same with Sorghum since it is a top export to China…
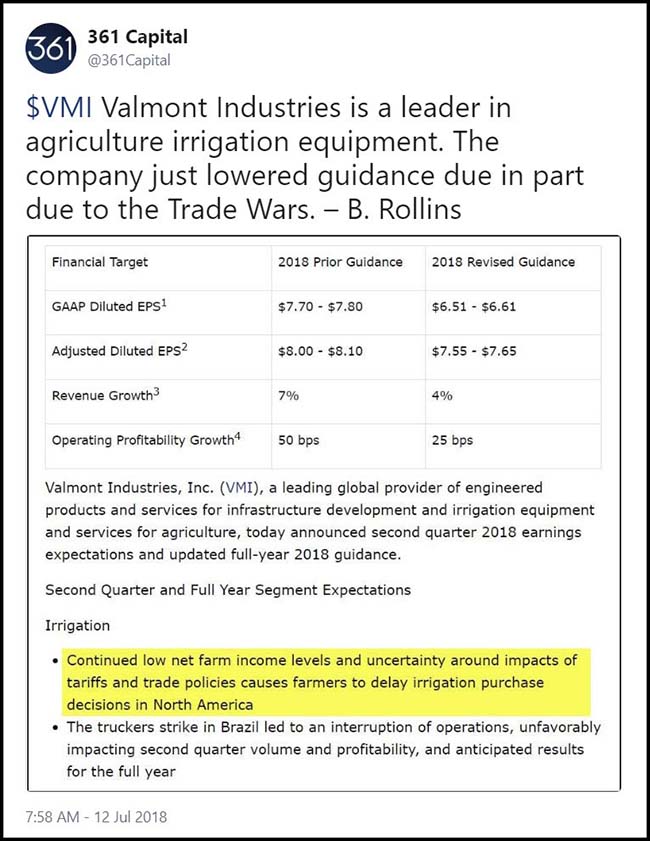
Following the agriculture ripples…
Good news for bacon lovers is bad news for anyone that touches a live hog…
Still, what’s been a boon for carnivores is hurting American farmers.
Tariffs from China and Mexico mean “40 percent of total American pork exports now are under retaliatory tariffs, threatening the livelihoods of thousands of U.S. pig farmers,” the National Pork Producers Council said in an emailed statement on July 6. “We now face large financial losses and contraction because of escalating trade disputes.”
That spells trouble for Maschhoff Family Foods, a pig producer in Carlyle, Illinois. The hog unit could post a loss of $100 million in the year that stared on July 1, according to Ken Maschhoff, chairman of the company. That would be a record loss in a 12-month period for the operation, which sells about 5.5 million hogs a year from 550 farms across nine states.
Rather than expand domestically, the company may invest in hog production in Europe or South America if trade tensions persist, he said.
“We had anticipated kind of a decent 2018 year, with a break-even 2019 year, and now both years will be in the red for us,” Maschhoff said.
From hogs to horsepower: Put BMW’s Spartanburg & Greer, South Carolina plants on layoff watch…
“The automotive industry is a global industry,” said Michael O’Kronley, a top executive at A123 Systems, an electric vehicle battery maker purchased out of bankruptcy by the Chinese company Wanxiang in 2013. “If you’re going to supply products into that, you need to be global.”
General Motors (NYSE:GM) now sells many more cars in China than it does in the United States, and the largest exporter of cars from the United States by value is not an American brand, but BMW. By some calculations, the car with the highest proportion of United States and Canadian-made content is the Honda Odyssey — and even that includes roughly a quarter of foreign-made parts. Companies — and their workers — say they recognize there are certain risks from sharing their technological secrets with Chinese competitors, but they say it is no longer a choice whether Michigan, the automotive capital of North America, should engage with China, the world’s largest auto market.
“You can’t separate the two,” Jerry Xu, former president of the Detroit Chinese Business Association, said of China and Michigan. “You’re going to kill the industry if you try.”
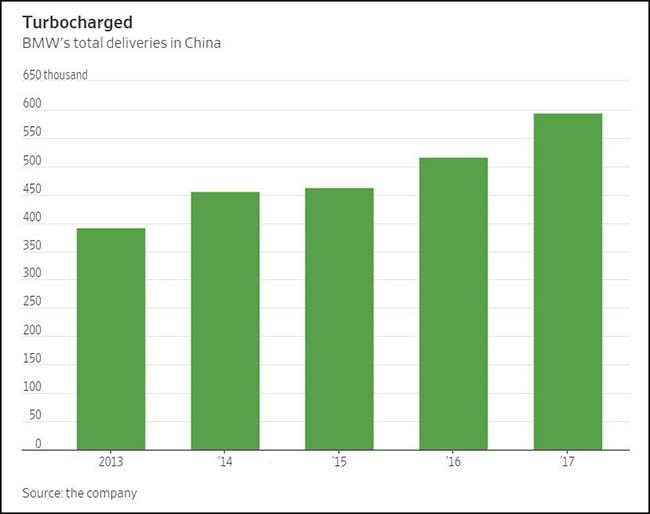
This BMW plant in South Carolina is a global giant which feeds China…
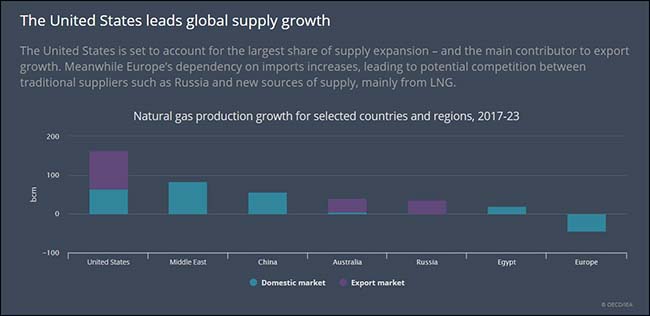
As of today, liquified natural gas has not been hit by the trade wars…
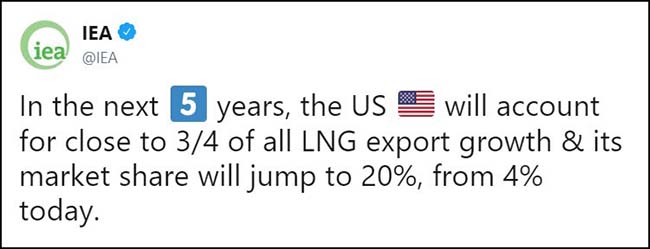
And Houston is praying that it doesn’t get included…
Don’t be surprised when auto and home sales data points show a slowdown in coming months…

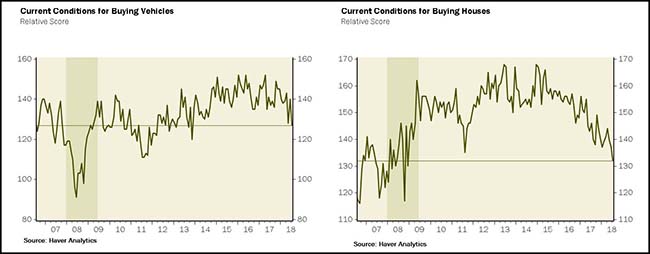
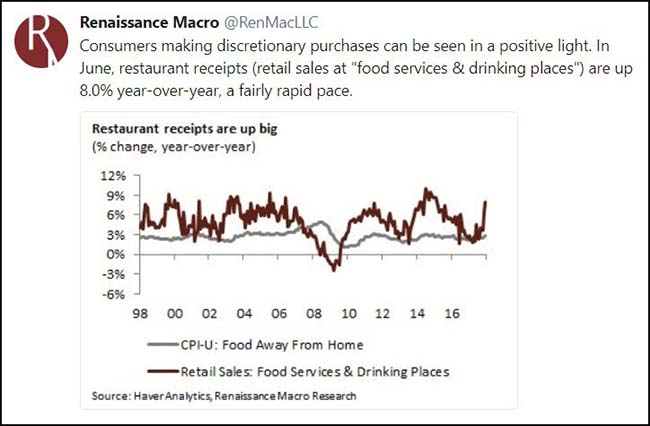
Instead of big purchases, consumers are looking for smaller ticket spending increases like eating out…
A small list of global equity markets which are outperforming the U.S. indexes this year…
2018 YTD Equity Indexes:
Saudi Arabia +15.7% priced in US dollars (+15.7% in riyals),
NASDAQ +13.4% in dollars (+13.4% in dollars),
Russia +2.4% in dollars (+11.2% in rubles),
Portugal +7.2% (+10.4%),
Russell +9.9% (+9.9%),
Norway +9.5% (+8.8%),
New Zealand +2.4% (+7.5%),
Colombia +11.6% (+6.8%),
UAE +6.6% (+6.6%),
Finland +2.9% (+5.9%),
S&P 500 +4.8% (+4.8%)
(Erik Peters)
For the week the Nasdaq again led all markets…
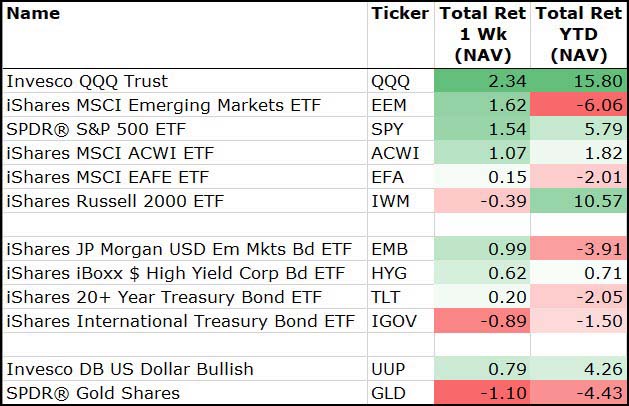
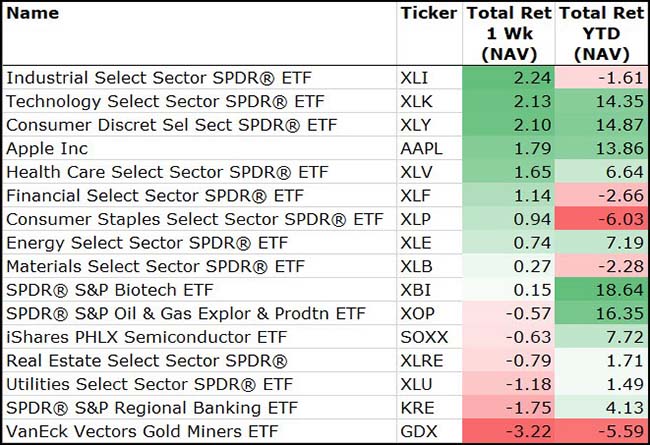
Tech and Consumer Discretionary led again while Industrials bounced…
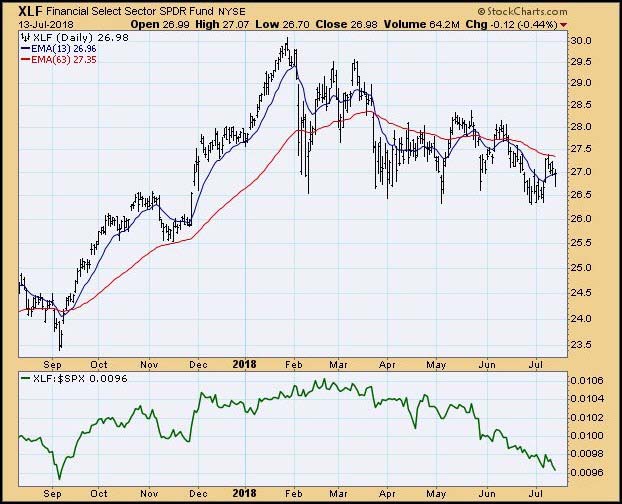
Banks had a tough week due to the uninspiring results from four big early reporters (JPM, C, PNC, WFC).
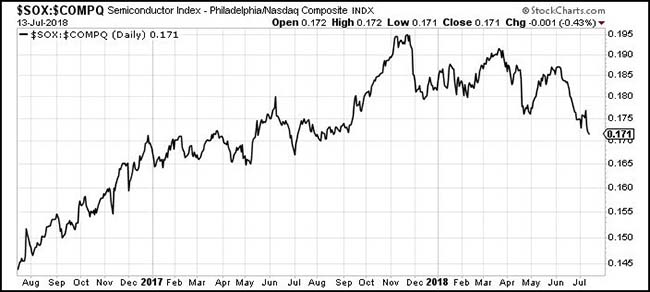
Amazing how well tech (XLK) has done with the trade war impacted Semiconductor (SOXX) group tied behind its back…
(@hmeisler)
Financial (XLF) stocks nearing a one-year low in relative performance…
