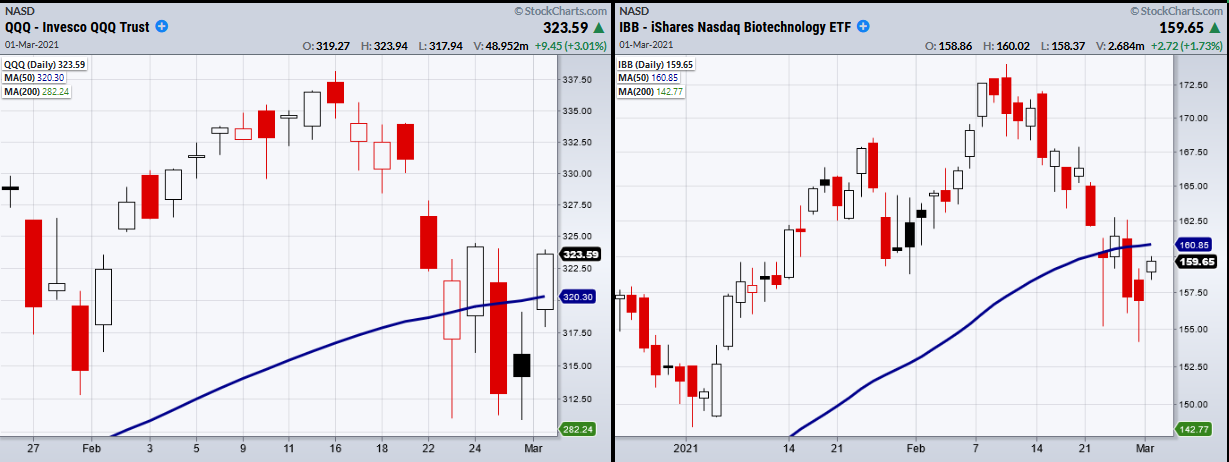
Last Friday the market ended on a cliffhanger.
The Nasdaq 100 (QQQ) closed under its 50-day moving average while the S&P 500 (SPY) and Dow Jones (DIA) teetered on the edge of their 50-DMAs.
Not only did the market gap higher Monday, but the QQQs ended the day back over its 50-DMA.
Talks of stimulus and a new vaccine approval for Johnson & Johnson (NYSE:JNJ) helped the market stay over a pivotal area.
In fact, it was the perfect boost of news since the biotech sector (IBB) had broken down a considerable amount throughout last week.
Though IBB did not have a huge comeback Monday, it stopped the bleeding.
Additionally, the biotech space will need to clear back over its 50-DMA at 160.85 to get back on track if the market continues its upward trend.

Another factor in last week's price breakdown was U.S. Treasury bonds (TLT), which had its price surge on Friday.
Speculation that the Federal Reserve will increase rates due to inflation is always in the back of investors’ minds, and any cause for alarm can ignite the flame of volatility.
While this is inevitably the case, for now the Federal Reserve has stayed accommodative with rates.
The push for more stimulus and for a possible infrastructure bill implies that the major concern for the Fed is not on inflation, but on the unemployment rate.
It is common economic thought that increasing the flow and trade of money is like increasing a country's overall wealth.
With that said, rising inflation will need to be addressed at some point.
Continue to watch the short-term yields as well. Considering they came down a bit on Monday, they can still turn out as a party pooper if either stimulus or some other firm action by the Fed does not happen in the near future.
- S&P 500 (SPY) Support 380. Resistance 394.17
- Russell 2000 (IWM) 230.32 resistance
- Dow (DIA) 309 support. Resistance 320
- NASDAQ (QQQ) Needs second close over the 50-DMA at 320
- KRE (Regional Banks) 64.62 the 10-DMA
- SMH (Semiconductors) 234 main support. Cleared the 10-DMA at 247.17.
- IYT (Transportation) Sitting close to all time highs at 241.36
- IBB (Biotechnology) Resistance 160.85
- XRT (Retail) 85.69 resistance
- Volatility Index (VXX) Recent low 14.44
- Junk Bonds (JNK) Flirting with the 50-DMA at 108.83
- LQD (iShares iBoxx $ Investment Grade Corp Bond ETF) Inside day
- IYR (Real Estate) Main support 86
- XLU (Utilities) 60.30 the 50-WMA
- GLD (Gold Trust) Watching for 160 to hold
- SLV (Silver) Sitting right on the 50-DMA at 24.57
- VBK (Small Cap Growth ETF) 290.25 the 10-DMA
- UGA (US Gas Fund) Watching 30.86 the 10-DMA to hold
- TLT (iShares 20+ Year Treasuries) 136.61 new support
- USD (Dollar) 90.41 new support
- EZA (South Africa) 48.21 the 10-DMA
- MJ (Alternative Harvest ETF) 21.61 next support
- WEAT (Teucrium Wheat Fund) Support 6.21 the 50-DMA
