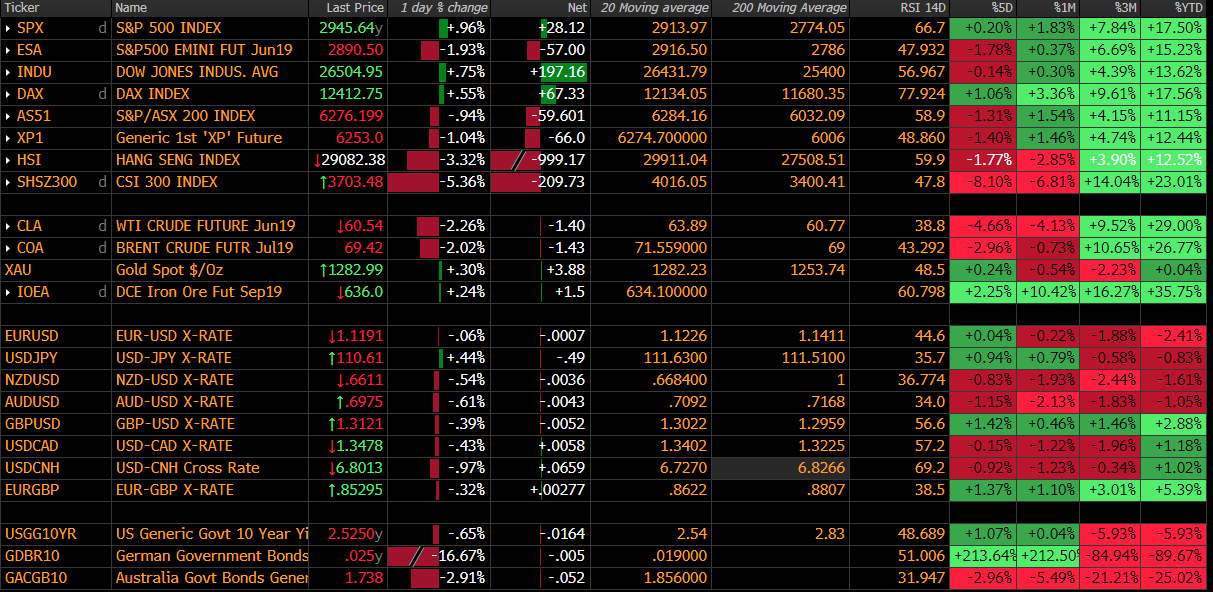
The market has been treated to a genuine shock this morning, with the now infamous Trump trade tweet. Granted, we had all known US-Sino trade talks were at the pointy end of proceedings, and that Trump has gone to Twitter in previous episodes, using rhetoric as a bargaining tool. However, today's comments hit us at a time when most were expecting some sort of market-friendly resolution to be formally announced in the next two weeks. So, by threatening to tax the $200b tranche of China’s exports (to the US) at 25% by Friday, he has enforced credibility 'put' in the market. All the focus falls on whether China’s top negotiator Liu He officially cancels his planned visit to Washington (due Wednesday), an outcome the WSJ suggests is being ‘considered’, and what Edward Lawrence (FOX business correspondent) is reporting as having happened.

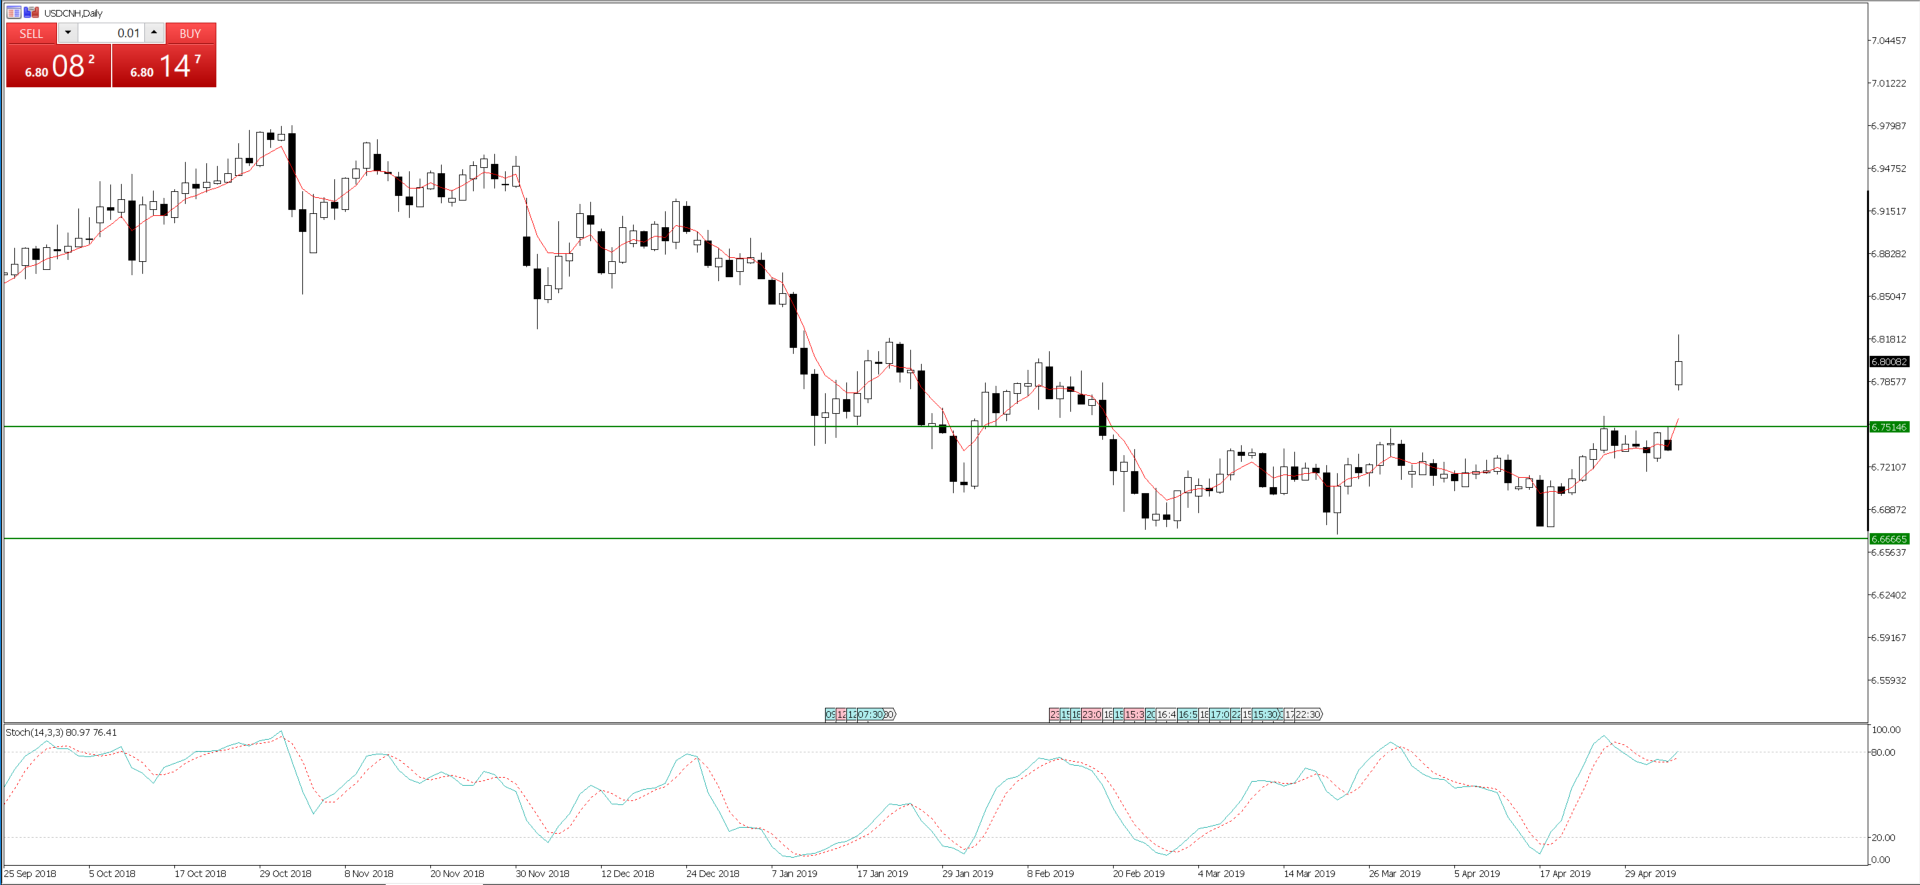
If the visit is formally canceled, then Trump simply has to hike tariffs on the $200b of goods to 25%. A fate that will exasperate today's tightening of global financial conditions, as traders buy volatility and unwind much of the good-will seen in markets of late and ask what now for the global economy? A further consideration in the tweet was what actually constitutes “shortly”, in relation to placing a 25% tariff on the remaining $325b balance of US imports. So, providing we see the $200b tranche taxed at 25%, then exactly how long will the US give China to come back in-line with US demands before it considers tariffs on the balance of trade. A week, a month? The market has limited clarity at this stage. Judging by some of the narratives in the Chinese press it seems that on the face of it, if Trump wants to formally break away from the trade truce, then it’s on, and they are prepared for it. It’s no surprise that we are seeing USD/CNH is a sizeable 1.0% higher on the day and firmly breaking out of its multi-month range.

USD/CNH 1-month implied volatility is also breaking higher, and this is key, as recall one of the key reasons as to why G10 FX vols have been at or near historic lows has been the PBoC’s move in mid-February to target stability in the yuan. Options traders are betting that stability targeting is looking less likely and that could have huge implications for FX markets.
Is this merely a threat aimed at firming the US trade teams’ hand, and, if Liu He formally cancels the prospected trip, is there any way back?
There are just no buyers of risk here, and we see S&P 500 futures down 1.8%, which given the low vol environment has hit us smack bang in the face, and we’ve felt it. Chinese equity indices have fared far worse, with China A50 index -5%, which is a 3.4 Z-score move. The ASX 200 is 0.8% lower, and off of the early low of 6248, with financials now taking 19-points out of the index, and certainly not assisted by an uninspiring result from Westpac. The greater focus from clients though has been to unwind carry exposures, and that means square and reversing into the JPY and CHF, with a specific focus on being short AUD, ZAR and MXN. Of course, being short AUD holds risk given the market is already short AUD in size, notably by asset managers, but as long as USD/CNH goes higher and then, AUD/USD will go lower in appreciation.
Whether it is a reflection of trade, the probability of a rate cut tomorrow from the Reserve Bank has increased by nearly ten percentage points to 47%. Aussie 3-year bond yields have moved 5bp lower and into a new record low, while AUD/USD implied vol has ramped up, as you’d expect, and sits at a lofty 22% for tomorrow, which to give context gives an implied move of 70-points by tomorrow. My own view is there is a strong case to hold and also to ease and in this dynamic, I would personally be reducing my AUD exposures into this meeting, as the playbook is quite convoluted. That said, with the meeting a 50:50 probability, it makes sense for the RBA to use this lack of definitive pricing to get the AUD lower, which is really the main game in town here.

Consider that if we do see the wheels formally fall off the trade talks, then Trump will lean even harder on the Fed, and not just to cut rates, but increased demand for QE from his central bank. All the signs Trump is the clear MMT president, which is theory getting passed around.
The RBA needs to get ahead of the curve, cut rates and take a pro-active stance.
So, we look ahead to see how European and US traders trade this move, and all signs are we should see European equities open around 1.5% lower. Its surprising EUR/USD, holding a fairly flat line, but it’s the low yielding currencies that have attracted the bid today. Expect German 10yr bunds to hold a negative yield by the end of European trade, and again, we ask how the ECB navigate through choppy waters and tighter financial conditions, especially with Brent crude trading over 2% lower.
