
On Thursday, equities continued to rally, as Western bourses were trying to get the most out of their last trading day of the week. US equity indices finished their trading sessions in the green. Also from the US, we received the initial and continuing jobless claims.
Santa Claus Rally
On Friday, the major markets were closed, but there were some that were open, but for a shorter time period, due to Christmas Eve. From the most popular ones, in Europe, CAC 40 and the FTSE 100 were operating till around lunch time.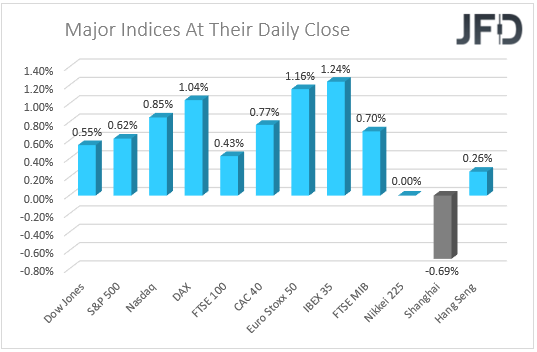
The S&P 500, DJIA, and NASDAQ gained slightly more than half a percent on Thursday. Best performing sectors in the US were industrials, consumer cyclicals, and basic materials.
Among the industrial stocks Howmet Aerospace (NYSE:HWM) was the best performer, closing with a 2.74% gain. Among consumer cyclicals, Tesla (NASDAQ:TSLA) continued to lead the way, ending the trading session with a 5.74% rise. From the basic materials sector, LyondellBasell Industries NV (NYSE:LYB) was the best performer during Thursday’s trading session, gaining 2.87%.
Real estate, utilities, and consumer defensive were the least performing sectors in the US on Thursday. In real estate, Digital Realty Trust (NYSE:DLR) lost 0.93%. Among utilities, American Water Works (NYSE:AWK) was the biggest loser, ending the session at -0.70%. In the consumer defensive sector, Kroger (NYSE:KR) was the worst performer, finishing Thursday’s trading at -0.71%.
DAX – Technical Outlook
After reversing higher on Monday, DAX continued to climb higher, while trading above a short-term tentative upside support line taken from the low of Dec. 20. Thursday, the German index managed to break above a short-term tentative downside line, drawn from the high of Dec. 7. All this paints a somewhat positive picture, at least for the near term. But we would still prefer to wait for a pop above the 15859 barrier, in order to get comfortable with higher areas.
If, eventually, DAX pushes through the 15859 hurdle, which is the current highest point of December, this will confirm a forthcoming higher high, possibly attracting more buyers into the game. The index might then travel to the 15965 obstacle, or to the 16055 zone, marked by an intraday swing high of Nov. 23. If the price continues to trade somewhere above the aforementioned upside line, we will aim further north, where the next possible target could be at 16202, marked by the high of Nov. 22.
Alternatively, if the index drops below both previously mentioned trendlines and then falls below the 15600 zone, marked by Thursday's low, that may spook some bulls from the field temporarily. DAX might then drift to the 15424 obstacle, or even to the 15302 level, marked by the low of Dec. 21.
US Data Dump Before Christmas
On Thursday, from the US, we received the initial and continuing jobless claims. The initial ones came out as expected, at 205k, whereas the continuing ones showed up above the forecast. Initially, it was believed that the reading will come out below the forecast of 1820k, but the actual number was at 1859k.
Also, from the US, we received the core durable goods orders on a MoM basis for the month of November. That figure managed to beat the forecast of +0.6% and showed up at +0.8%. The US also delivered the personal spending figure for November, which was in line with the forecast, at +0.6%.
Another piece of data which we received Thursday was the Canadian MoM GDP figure for the month of October. There were no surprises there and the number came out as expected, at +0.8%.
USD/JPY – Technical Outlook
Looking at the current technical picture for USD/JPY, we can see, at time of writing, that the pair is currently trading inside a rising channel pattern, which has been in play from around the beginning of December. At the same time, the rate remains above the 21 EMA on our 4-hour chart, which may also be seen as a positive.
If the pair drifts a bit lower, but continues to trade above that 21 EMA, we may see the bulls picking the pair up and potentially pushing it higher, back to the 114.51 zone, which is the current highest point of December. If the buying doesn’t end there, USD/JPY might end up testing the upper side of the aforementioned channel, or even the 114.82 level, marked by the inside swing low of Nov. 24.
On the other hand, if the rate falls all the way below the 114.05 hurdle, marked near the low of Dec. 22, that could result in a larger correction lower within the rising channel. USD/JPY may drift to the 113.77 obstacle, a break of which might set the stage for a test of the 113.55 level, marked by the low of Dec. 21. Around there, the pair could also test the lower side of the rising channel, which may provide additional support.