
Equities and other risk-linked assets gained, while safe havens slid on Monday and during the Asian morning Tuesday on hopes that talks in US Congress over a new coronavirus-aid bill will resume, and perhaps bear fruit as soon as this week. As for tonight, during the Asian morning Wednesday, the RBNZ decides on monetary policy. Although we see decent chances for this Bank to stand pat, we believe that officials will reiterate their concerns over the Kiwi’s appreciation.
EQUITIES GAIN, SAFE HAVENS SLIDE, ON OPTIMISM OVER A NEW US FISCAL PACKAGE
The US dollar traded lower against the majority of the other G10 currencies on Monday and during the Asian morning Tuesday. It underperformed against NOK, CAD, AUD, NZD, and GBP in that order, while it eked out gains only versus EUR, JPY, and CHF. The greenback was found virtually unchanged against SEK.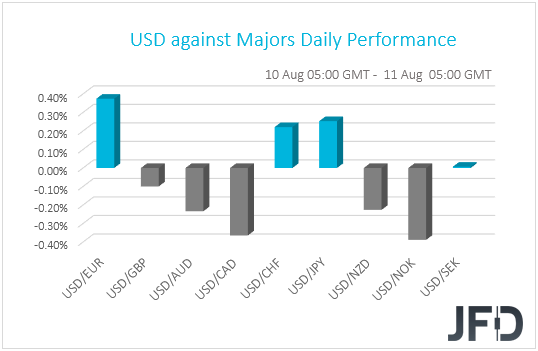
The strengthening of the commodity-linked currencies, combined with the weakness in the safe havens, suggests that financial markets traded in a risk-on fashion. Indeed, turning our gaze in the equity world, we see that EU indices were a sea of green, with the positive morale rolling into the US session. Both the Dow Jones and the S&P 500 gained 1.30% and 0.27% respectively, with the exception being Nasdaq, which slid 0.39% as investors seem to have turned into value stocks from heavyweight tech-related names. Sentiment remained supported during the Asian session today as well, with Japan’s Nikkei 225, China’s Shanghai Composite and Hong Kong’s Hang Seng gaining 1.81%, 0.46%, and 2.63% respectively.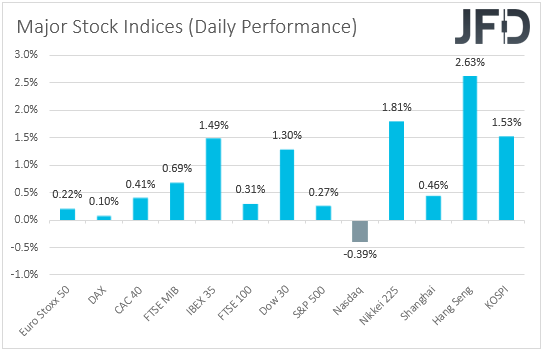
After talks in the US Congress over a new coronavirus-aid bill fell apart on Friday, on Saturday, US President Trump signed executive orders and memorandums aimed at unemployment benefits, evictions, student loans and payroll taxes, which may have been the reason behind the sanguine investor morale. What may have also helped are Sunday comments by House Speaker Nancy Pelosi and Treasury Secretary Steven Mnuchin that they are open to restarting talks. In an interview with CNBC yesterday, Mnuchin added that the Trump administration and Congress could reach an agreement as soon as this week if Democrats are “reasonable”.
Apart from developments surrounding the new fiscal stimulus package in the US, investors are also awaiting a meeting between top US and Chinese officials on Saturday, in which they are set to review the first six months of the Phase-One trade accord. That said, the relationship between the world’s two largest economies does not appear to be a rosy one. Last week, Trump unveiled sweeping bans on Chinese tech firms TikTok and Tencent, while China imposed sanctions on 11 Americans yesterday in retaliation for US’s sanctions on Chinese officials over Hong Kong. On top of that, yesterday, Treasury Secretary Mnuchin said that companies from China and other countries that don’t comply with the US accounting standards will be delisted from US stock exchanges as of the end of 2021.
The markets appear to have remained broadly immune to developments surrounding the US-China saga, and it remains to be seen whether this will be the case for the rest of the week. If so, a potential accord in the US Congress may add further fuel in investors’ morale, pushing equities and other risk-linked assets further up and safe havens down.
Back to the G10 currencies, the oil-related NOK and CAD were the main gainers, getting an extra boost from the rising oil prices. Both Brent and WTI gained 0.63% and 0.77% respectively yesterday as, apart from the broader appetite, Saudi Aramco’s CEO Amin Nasser said that he sees oil demand rebounding in Asia, as economies gradually open up.
FTSE 100 – TECHNICAL OUTLOOK
In the beginning of August, the FTSE 100 reversed to the upside and is now trading above a short-term upside support line taken from the low of August 3rd. Currently, looking at our 4-hour chart, it seems that the index is painting a failure swing bottom picture, which may help more bulls to join in, especially if the price climbs above the 6112 barrier, marked by the current highest point of August. We will take a bullish stance for now.
A push above the aforementioned 6112 barrier would confirm a forthcoming higher high and may clear the path for a further acceleration. Such a move might also lift the price above the 200 EMA, what could be seen as a positive for more buyers. The FTSE 100 may then travel towards the highs of July 28th and 29th, at 6163, where it might get held temporarily. The index could even retrace back down from there, however, if the price stays above the previously discussed upside line, the buyers may step in again and drive the index higher. If this time the 6163 barrier fails to provide resistance and breaks, this would confirm another forthcoming higher high and might lead the FTSE 100 to the 6186 zone, or the 6216 area, marked by intraday swing lows of July 23rd.
On the other hand, if the aforementioned upside line breaks and the price falls below the 6065 hurdle, marked by the current low of today, that might scare the bulls away, possibly opening the way for further declines. The index could travel to the 6025 hurdle, which is the low of August 10th, where it may get held for a bit. That said, if the bears remain in the driver’s seat, a break of that hurdle may send the FTSE 100 to the 5993 obstacle, or even the 5978 level, marked by the lows of August 7th and 6th respectively.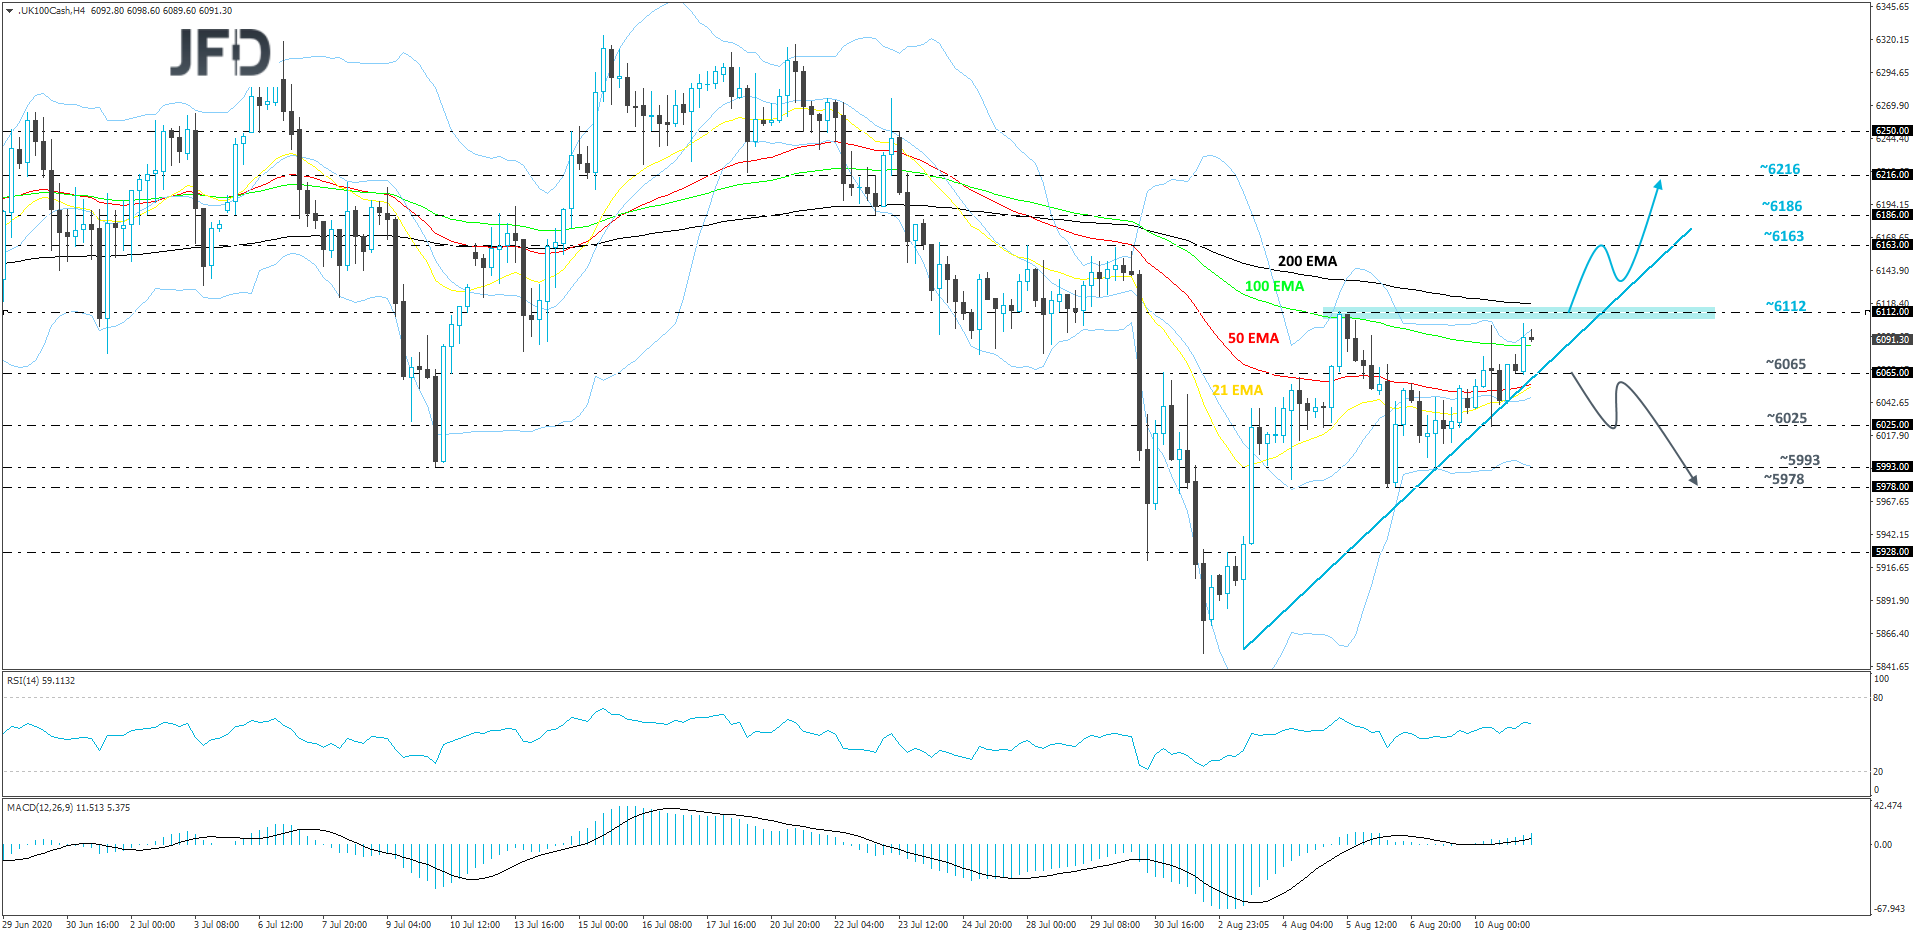
AUD/JPY – TECHNICAL OUTLOOK
USD/JPY continues to balance above a short-term upside support line taken from the low of June 26th. Looking at our oscillators, the RSI and the MACD, both started pointing higher, indicating an increase in the upside momentum, which may support a further continuation move north. As long as the rate stays above the aforementioned upside line, we will remain positive with the near-term outlook.
A push higher may bring the pair closer to the high of last week, near the 76.44 hurdle, which might temporarily provide resistance. AUD/JPY could even retrace back down a bit, however, if it stays somewhere above the 76.00 zone, that may help the bulls to take charge and lift the rate up again. If this time the 76.44 barrier surrenders, its break would confirm a forthcoming higher high, possibly opening the way for AUD/JPY to drifts further north. That’s when we will aim for the 76.70 obstacle, or even the 76.86 level, marked by the highs of July 23rd and 22nd respectively.
Alternatively, if the pair drops sharply and ends up breaking the aforementioned upside line and sliding below the 75.48 area, marked by the low of August 4th, that could spook the bulls from the field temporarily. AUD/JPY might then travel to the 75.27 hurdle, or even the 75.10 zone, marked by the low of August 3rd. The rate may get a hold-up around there, as it would also test the area around the 200 EMA. That said, if the sellers are still feeling a bit more comfortable, a break of that 75.10 zone could clear the way to the low of July 30th, at 74.82.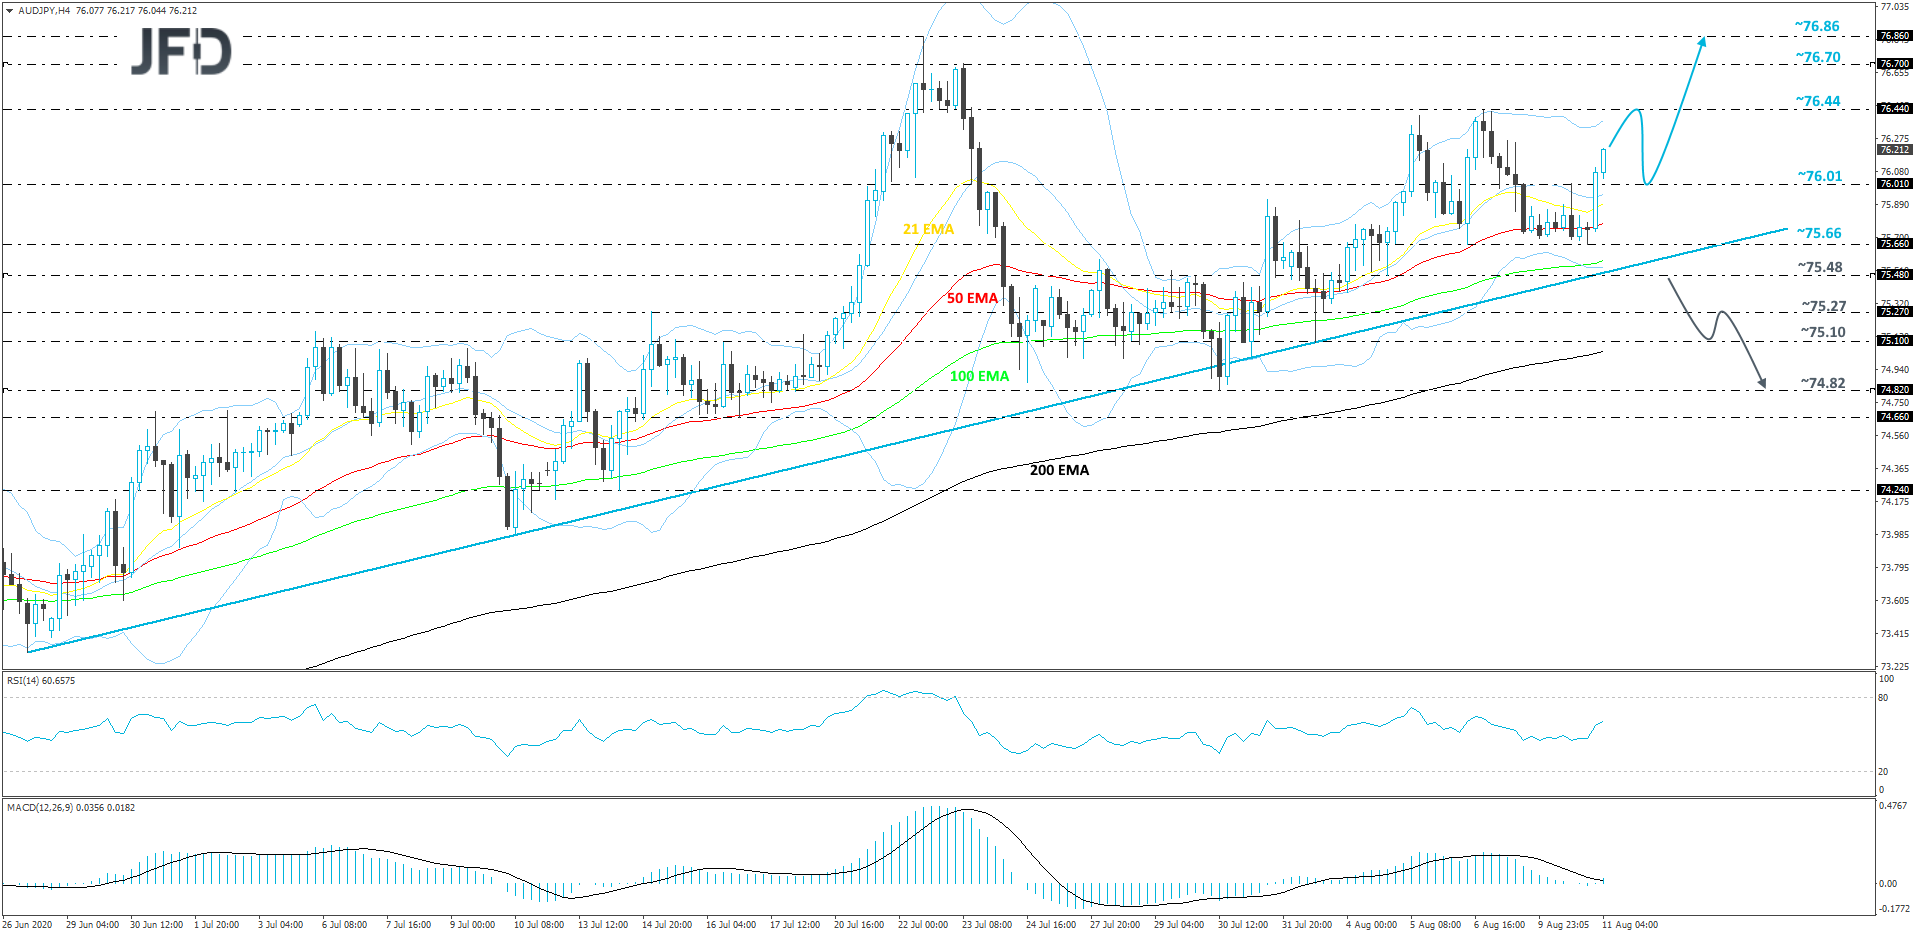
WILL THE RBNZ STAND PAT AGAIN?
Tonight, apart from developments surrounding the broader market sentiment, NZD-traders may also pay attention to the RBNZ monetary policy decision. At its previous gathering, the RBNZ decided to keep interest rates and its Large-Scale Asset Purchase (LSAP) program unchanged, with officials noting that their nation has contained the spread of the virus, enabling an earlier resumption of economic activity than assumed in May. However, they highlighted that the appreciation of their local currency has placed further pressure on exports and that the balance of economic risks remains to the downside, adding that they remain willing to ease their policy further if deemed necessary.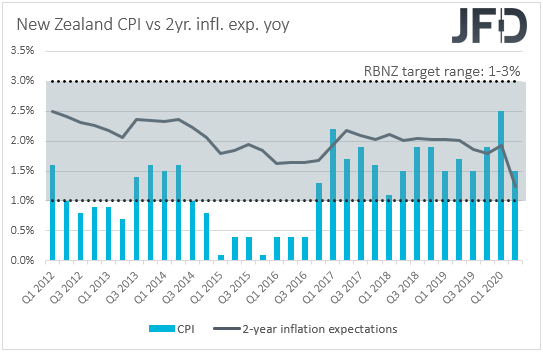
In Q2, inflation slowed in New Zealand, to +1.5% YoY from +2.5% YoY, but this is still higher than the Bank’s own forecast for the quarter, which was at +1.3% YoY. Thus, this may allow RBNZ officials to stand pat for another meeting, but with the Kiwi slightly higher against the dollar than it was the last time they met, we also expect them to reiterate concerns over its appreciation, as well as their readiness to ease further if needed.
As for the Kiwi, if the RBNZ reiterates concerns over its appreciation, it could slide. However, its broader direction is likely to stay mostly linked to developments surrounding the broader market sentiment. If the US Congress reaches consensus and the US-China tensions ease somewhat, the currency is likely to resume its prevailing uptrend, especially against the safe-haven dollar. That said, further strength in the Kiwi could increase the chances for additional stimulus by the RBNZ at one of its upcoming gatherings.
AS FOR TODAY’S EVENTS
During the European morning, the UK employment report for June is due to be released. The unemployment rate is forecast to have risen to 4.2% from 3.9%, while average weekly earnings including bonuses are expected to have declined 1.2% yoy after sliding 0.3% in May. The excluding-bonuses rate is also expected to have fallen, to -0.1% yoy from +0.7%. The case for a weak report is supported by the KPMG and REC, UK Report on Jobs for the month, in which it was noted that starting pay for both permanent and short-term staff fell further in June as demand for workers remained weak and labor supply continued to increase.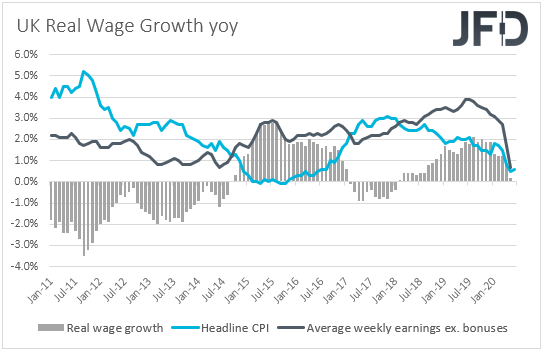
From Germany, we get the ZEW survey for August. The current conditions index is expected to have increased to -68.8 from -80.9, but the economic sentiment one is anticipated to have slid to 58.0 from 59.3. This suggests that analysts’ opinions with regards to the current performance of the German economy have improved following the agreement between Eurozone’s members over a coronavirus-related rescue fund, but fears over a second wave of infections in Europe may have raised questions with regards to the future. The euro skyrocketed in the aftermath of the deal over the rescue package, but another round of accelerating infections may be the trigger for a decent downside correction.
Later in the day, Canada’s housing starts and the US PPIs, both for July, are coming out. Canada’s housing starts are forecast to have slowed somewhat, while the US PPI headline rate is forecast to have ticked up to -0.7% YoY from -0.8%. The core rate is expected to have rebounded to +0.1% YoY from -0.3%.
With regards to the energy market, the API (American Petroleum Institute) weekly report on crude oil inventories is coming out, but as it is always the case, no forecast is currently available.
We also have one speaker on today’s agenda: San Francisco Fed President Mary C. Daly.