
The US dollar slid, while equities rebounded yesterday, perhaps as fears over high inflation eased somewhat. With no clear catalyst to ease those fears, we believe that it may have been the decline in the US Philly manufacturing activity index. Taking this into account, today, market participants may pay extra attention to the PMIs for May from the Eurozone, the UK, and the US.
US Dollar Slides, Equities Rebound As Taper Talk Concerns Ease
The US dollar turned down against all but one of the other G10 currencies on Thursday and during the Asian session Friday. It lost the most ground versus CHF, SEK, GBP and EUR in that order, while it underperformed the least against AUD and NZD. The greenback eked out some gains only versus NOK.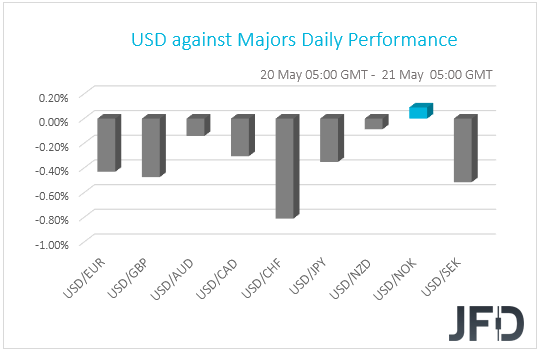
The weakening of the US dollar suggests that market sentiment may have turned to risk on yesterday. However, the strengthening of the Swiss franc and the relative weakness in the risk-linked Aussie and Kiwi point otherwise. Thus, in order to get a clearer picture with regards to the broader investor morale, we prefer to turn our gaze to the equity world. There, we can clearly see that major EU and US indices were a sea of green, with NASDAQ recording the biggest gains. That said, appetite softened again today in Asia. Although Japan’s Nikkei 225 gained, China’s Shanghai Composite and South Korea’s KOSPI slid, while Hong Kong’s Hang Seng stayed relatively unchanged.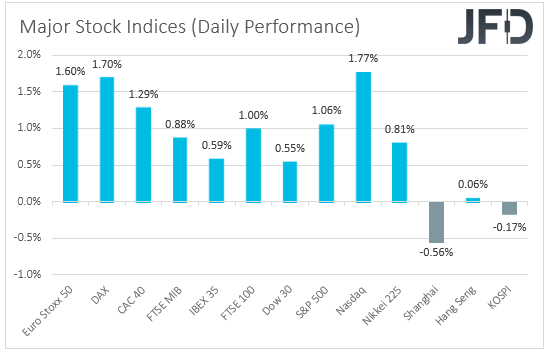
Market chatter suggests that the improvement in market sentiment may have been due to the better-than-expected US initial jobless claims for last week. However, we believe that this should have had the opposite effect. After all, following the surge both headline and core inflation in the US, as well as the taper talk revealed in the minutes of the previous FOMC gathering, this may be a step closer towards the beginning of normalization. In our view, the only indicator on the agenda which may have helped ease inflation fears is the Philly manufacturing activity index for May, which fell more than anticipated.
With that in mind, today, investors are likely to pay extra attention to the preliminary PMIs for the month, coming out from the Eurozone, the UK and the US. Eurozone’s manufacturing PMI is anticipated to have slid somewhat, but to have stayed at elevated levels. Specifically, it is expected to have declined to 62.4 from 62.9. The services index is forecast to have increased to 52.0 from 50.5. This is likely to drive the composite index up to 54.9 from 53.8, confirming that, with the vaccinations’ rollout, the Euro-area economy is recovering from the coronavirus pandemic at a decent pace. No forecast is available for the UK prints, while in the US, the manufacturing index is expected to have ticked down to 60.4 from 60.5, and the services one to 64.6 from 64.7.
With ECB President Lagarde saying on Tuesday that it is “essential that monetary and fiscal support are not withdrawn too soon”, we believe that improvement in Eurozone’s PMIs may prove positive for European equities. That said, this may not be the case in the US, as better-than-expected indices may add to speculation that with the US economy recovering at a fast pace and both headline and core inflation at elevated levels, the Fed may need to start thinking about scaling back some monetary policy support.
EURO STOXX 50 Technical Outlook
The Euro STOXX 50 cash index traded higher yesterday and today in Asia, and it is now approaching the key resistance of 4042, which has been preventing the index from drifting higher since Apr. 16. Overall, the price structure on the 4-hour chart shows a sideways movement, and thus, we will stay neutral for now. In order to get confident on more advances, we would like to see a clear break above 4042.
The bulls are likely to challenge once again that barrier soon, but we cannot rule out another pullback thereafter. That said, if they are strong enough to regain control from near the 3965 zone, we may see another rebound and perhaps a break above 4042. This will confirm a forthcoming higher high on both the 4-hour and daily charts and may open the path towards the 4165 area, defined as a resistance by the inside swing low of November 2007.
On the downside, we would like to see a dip below 3890, Wednesday’s low, before we start examining the case of a decent correction to the downside. The bears may initially target the low of May 13, at 3855, the break of which could carry extensions towards the 3782 obstacle, marked by the low of Mar. 25. If that barrier is not able to stop the slide either, then we could see declines towards the 3730 area, which acted as a resistance between Feb. 17 and Mar. 5.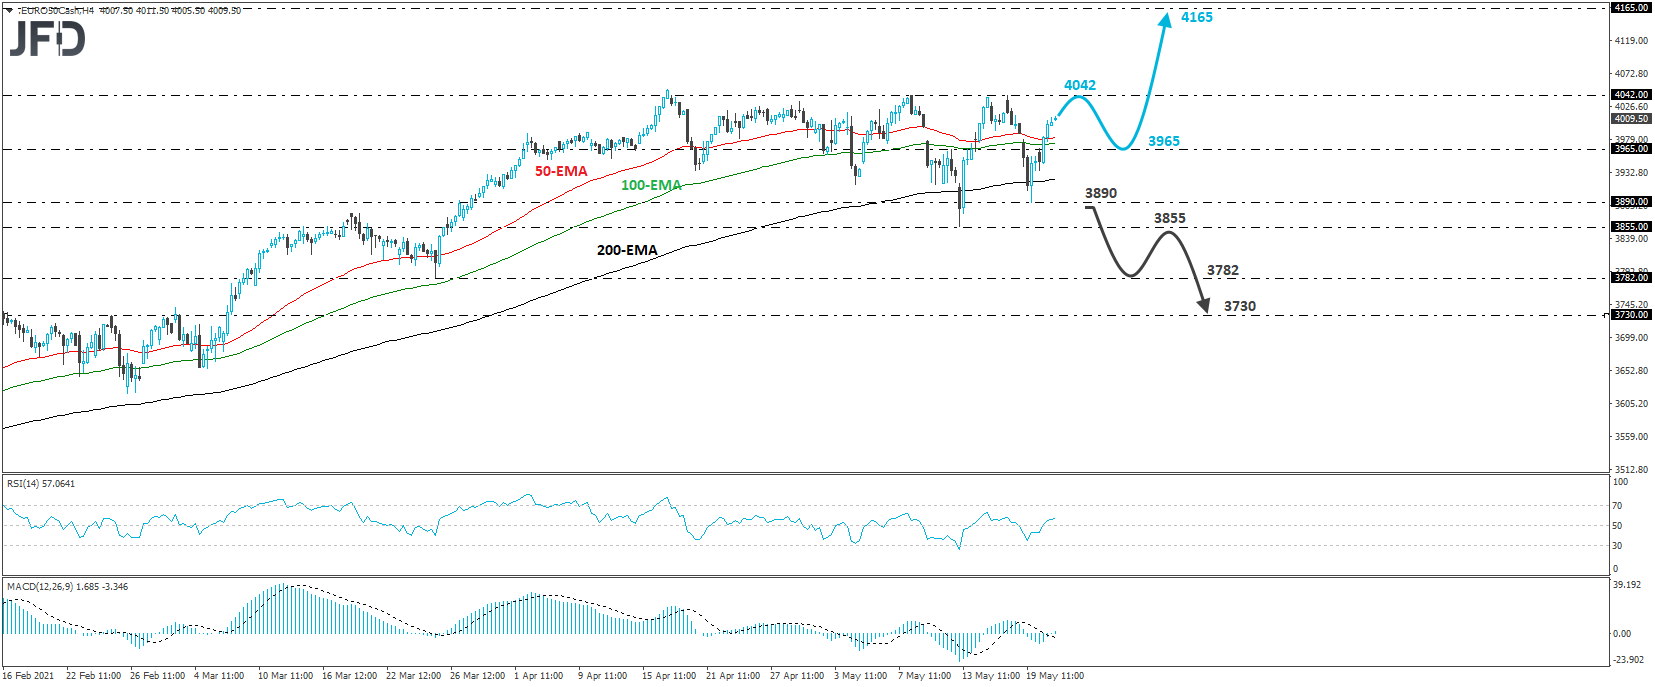
EUR/USD – Technical Outlook
EUR/USD also edged north yesterday, but the recovery was stopped once again near the 1.2243 barrier, marked by Wednesday’s high, as well as by the high of Feb. 25. Today, the rate pulled back somewhat. Overall, EUR/USD continues to trade above the upside support line drawn from the low of Mar. 31, and thus, we would consider the near-term outlook to be positive.
However, in order to get confident on more advances, we would like to see a clear break above 1.2243. This will confirm a forthcoming higher high and may initially target the 1.2285 barrier, marked by the high of Jan. 8. Another break, above 1.2285, could prompt the buyers to climb towards the peak of Jan. 6, at 1.2350.
In order to abandon the bullish case and start examining a short-term bearish reversal, we would like to see a dip back below 1.2125. This may confirm the break below the aforementioned upside line and may see scope for declines towards the low of May 13, at 1.2050. If the bears are not willing to give up yet, a break lower could extend the fall towards the 1.1985 territory, defined as a support by the low of May 5, where another break could target the low of Apr. 19 at 1.1942.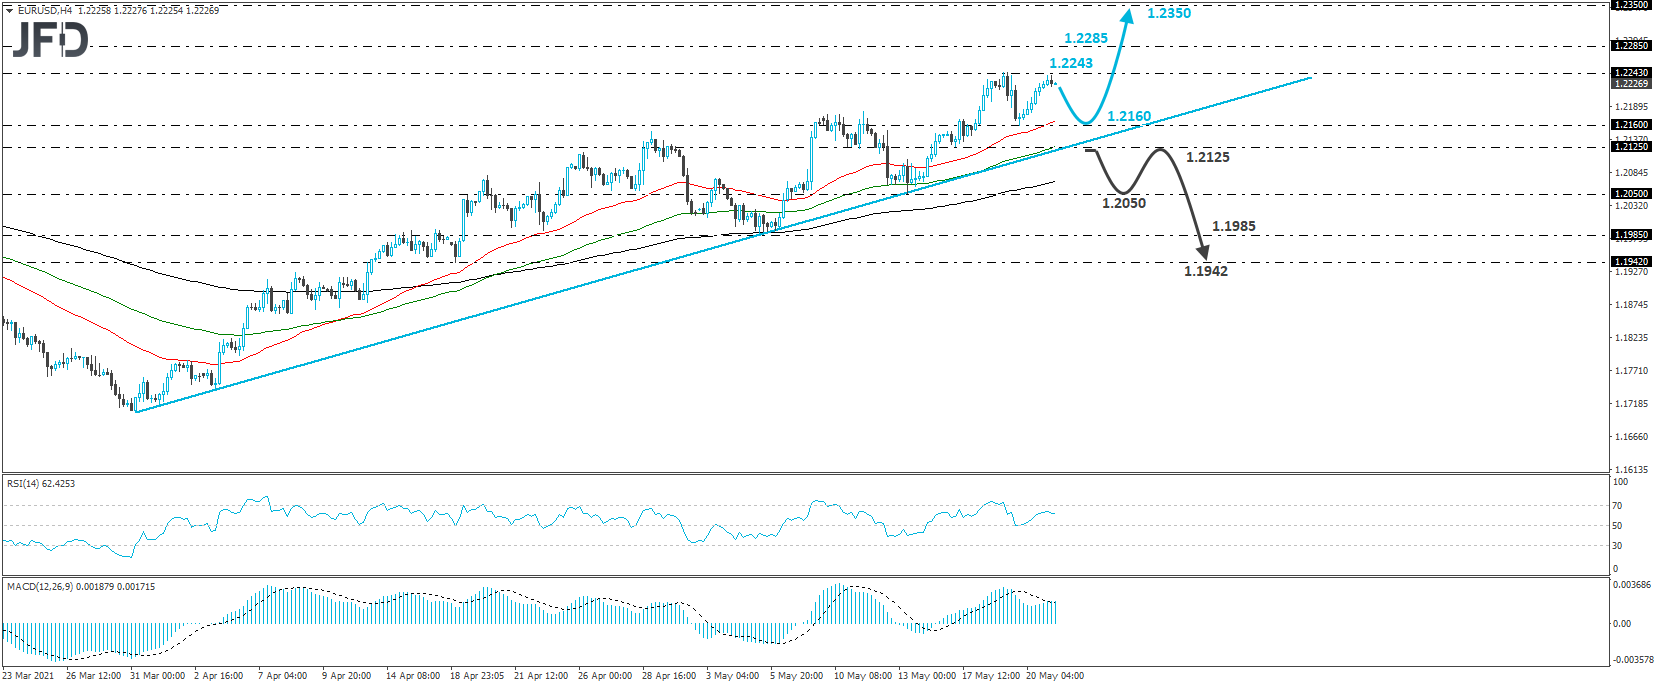
As For The Rest Of Today's Events
We have the UK retail sales for April, Canada’s retail sales for March, and the US existing home sales for April. The UK retail sales are expected to have slowed somewhat, but to have still increased at a strong rate. Canada’s sales are also expected to have slowed, while the US existing home sales are forecast to have risen.
We will also get to hear once again from ECB President Christine Lagarde.