While this report again looks at the markets’ (Dow, SLV) turnings points and their respective indices’ volatility charts, this article also examines the changing relationships between those volatility indicators and their related markets.
Therefore, the first section hereunder looks at the VIX followed by the Dow, while the second part examines the SLV and the VXSLV chart which precedes it. Each section concludes with the 2 relevant charts (plus GLD).
One critical conclusion will show that while one volatility-to-underlying index relationship may have only changed for the short term, the other may have altered on a longer-term basis.
VIX and DOW:
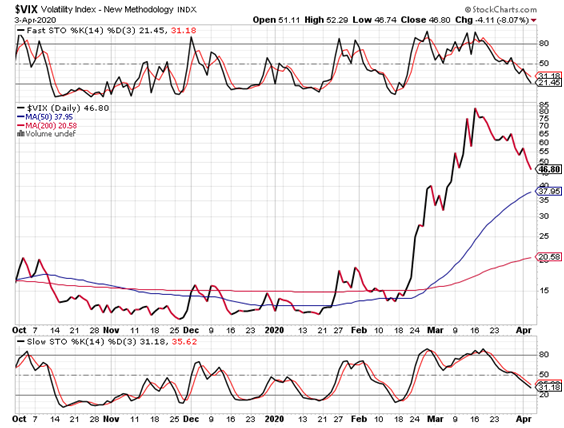
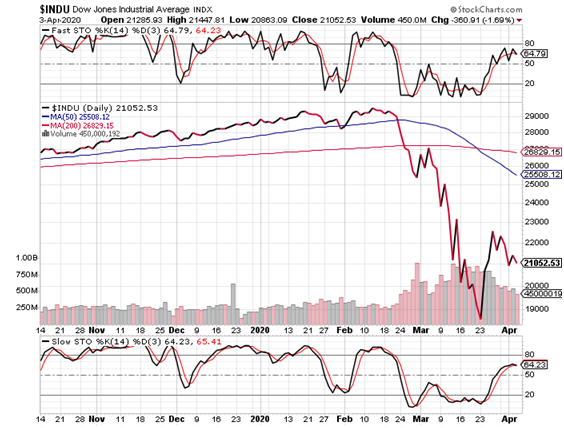
The first observation is that the VIX completed a clean 5-wave pattern on March 16. Understandably, that mirrored the Dow‘s bottom which occurred a week later (volatility premiums are a leading indicator).
The Dow then made a wave-4 peak (or “a” of 4) during the week of March 23. However, since that time, the VIX has continued to decline. As we can see, the VIX’s all-important slow stochastic (below the price chart) is approaching oversold readings. Importantly, this is occurring while the Dow and its stochastic are rolling over.
No doubt, the Dow could always rally to complete wave-4 (with a c-wave movement that only makes a marginal short-term high this month); in this scenario, I suspect that the next near term move would still be lower.
If we assume that the asymmetric relationship has only changed for the short term, then we would likely be talking about the VIX correcting toward 30 through April, while the Dow would likely be trending net sideways until ~May 1. In this scenario, the debacle would explode back into the headlines next month.
This scenario makes sense, both for interpreting the recent near-term symmetry between stocks and the VIX, and my anticipation of an explosion in the VIX from oversold levels. Whether within this scenario or a decline that resumes sooner, my panic low Dow target is 15,700.
Per above, I forecast this low in the Dow occurring in May for reasons upon which I will expand next time, when I will outline the fundamental events that should correspond to that watershed event.
Since August, I have been forecasting a 10,000-point Dow decline simply because I did not wish to appear sensationalistic in calling for a 50% smash. This remained the case up until the repeated identification of the peak “….at some number just under 30,000.”
Now that I foresee a real possibility for a continued VIX decline toward 30, I must remind that the income and protection strategy that I have recommended since the summer, and upon which engineering I did expand in the March 11, 2020 report, could offer the opportunity for reentry.
Per previous reports, my own engineering suggests post-liquidation reentries on VIX corrections toward 27.5.
VXSLV and SLV:
If the Dow’s rally is extended through this month while the VIX continues to correct, then the asymmetric relationship will have remained unchanged on a longer term basis, certainly once confirmed by another and perhaps final (for this year) market debacle that would be accompanied by a massive VIX spike higher.
I have almost no doubt, however, that the relationship between the SLV and the VXSLV has reverted. Despite the law of diminishing returns, volatility premiums spiked when silver declined after the 2011 peak.
Today, the market must be deeply concerned about the unlimited upside potential that a bull market presents for this low priced asset.
Simply put, through the bear market when the SLV was ripped after the 2011 peak just under $50, volatility premiums trended higher with silver declines. In 2019, however, the VXSLV mostly trended higher with the resumption of the metal’s secular bull market.
That all changed once the VIX erupted in historic fashion against a fear-driven backdrop of the pandemic, and the volatility premium eruption caused all financial rationalism to go out the window.
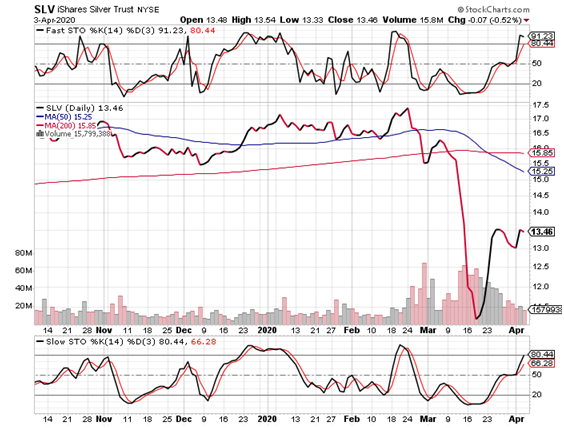
As recently reported, all of the SLV call strategies that I had recommended for speculators were mostly liquidated at break-even levels, despite the loss of time and ~$5.5 from 16.5 to 11. This was both unprecedented and mathematically nuts (see March 19, 2020 pre-open report).
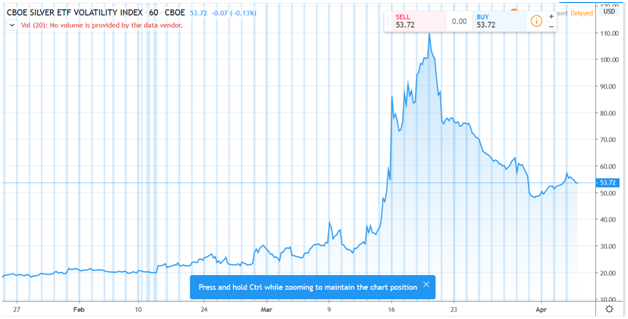
That stroke of luck was occurring while the VXSLV was making new all-time-highs at 110. Over a multi-week period during which the SLV was falling, calls actually rose. Like I write above, counterintuitively “nuts.”
Silver’s volatility indicator has been cut by more than half and, if, as I recommend, one were to establish new SLV positions based on the VXSLV, other indicators notwithstanding, then I would do so at some number approaching 40.
Historically, that would still be a lofty level, even though greatly discounted from its recent ATH at 110. To mitigate risk, I will likely advise a calendar spread so as be a seller of some of that volatility premium, should the opportunity present itself.
Simply, I anticipate a silver low by the end of May, coupled with the resumption of the codirectional relationship between silver and its volatility indicator.
From the March 19, 2020 pre-open report:
“All taken together, one can see that the SLV could rally to $13.5 and it wouldn’t even mean anything.”
Indeed, as we see below, the rally from the low just under $11 has occurred and, consistent with what I foresee for gold, a couple of soft months may still ensue.
(Commentary concludes after charts below.)
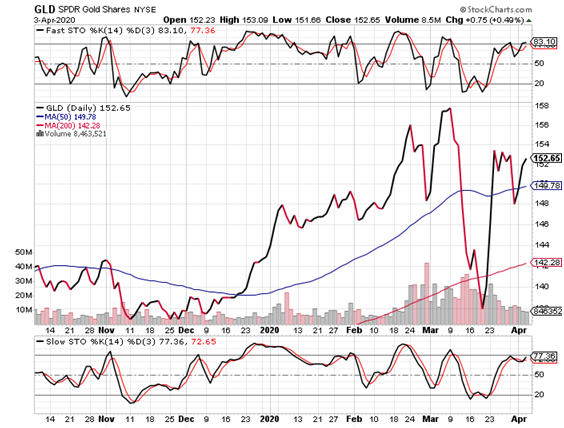
Per recent reports, the GLD’s March extremes were identified and I now believe that the next move will be lower. This could include a slight early-week uptick to push the slow stochastic (below price chart) into overbought territory.
Either way, long term holders should ignore these comments. Gold specifically, and the precious metals generally, are really all that one should own for the long haul.
Importantly, note that the new and unsustainable all-time high in the gold:silver ratio has, in all likelihood, reversed. The ratio hit 120, after breaking the previous peak of 100, a level that was previously challenged only twice over the past 100 years (see March 19, 2020 pre-open report).
