As a percentage of the S&P 500’s market cap, the Financial sector fell to below 10% to 9.9% this summer, down from a 20% just prior to the real estate sector being spun out of the index as its own sector in September, 2016.
As of last Friday, November 20, 2020, the market cap weight of the Financial sector had risen to 10.3% of the S&P 500’s market cap, still pretty low relative to its historical weight.
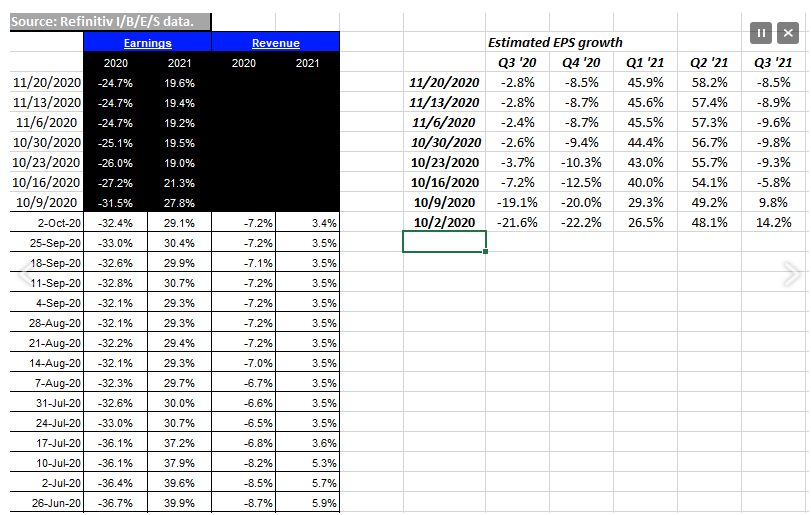
That being said, let’s look at the Financial sector’s EPS revisions and expected EPS growth rates:

The left-hand columns on the above spreadsheet were provided by Refinitiv’s earnings team—David Aurelio and Tajinder Dhillon—and shows “annual” expected EPS growth rate for the Financial sector for 2020 and 2021.
The second set of columns to the right are updated weekly from Refinitiv’s This Week in Earnings, and give readers a quarter-by-quarter analysis of the expected EPS growth trends for the sector and how that changes week-to-week.
Readers can see the sharp improvement in Q3 ’20 EPS expected growth as bank “LLP’s” or loan-loss provisions were sharply reduced in Q3 ’20 when earnings were reported.
For instance JP Morgan reported $600 ml in LLP’s for Q3 ’20 versus the $2.4 bl expected, which raised the expected JP Morgan 2020 EPS estimate from $5.90 on September 30, 2020 to $7.40 by October 31 ’20. JPM’s current EPS estimate as of today, 11/23/20 is now $7.44.
This was in fact broadly felt across the banking system as severe credit losses that were expected with the onset of COVID-19 never really materialized as of 9/30/20.
JPMorgan (NYSE:JPM) and Schwab (NYSE:SCHW) remain in the Top 10 client holdings and have been in the top 10 positions for several years at 5% and 4.5% of total market value respectively as of last night’s close.
Rather than randomly picking out banks and financials to cover for readers, actual client holdings are used as examples rather than buy / sell recommendations.
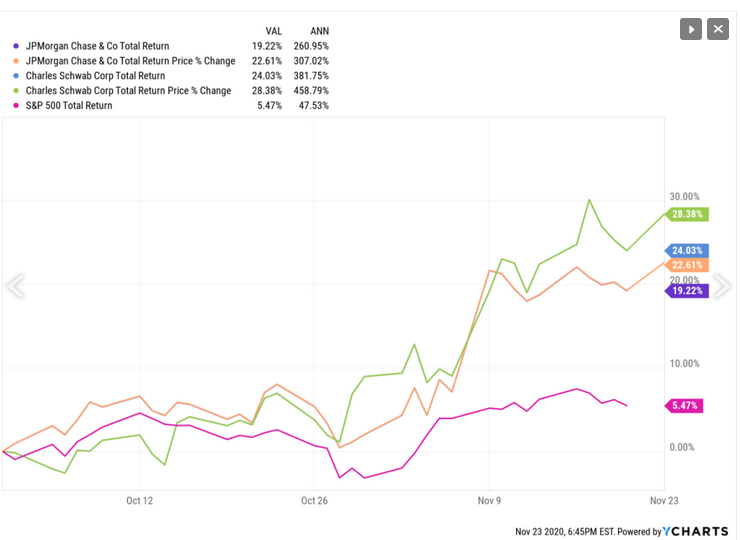
Here is how JP Morgan and Schwab have traded since October 1 ’20:

JP Morgan and Schwab have rallied sharply since early October ’20 when readers were given an update here and here.
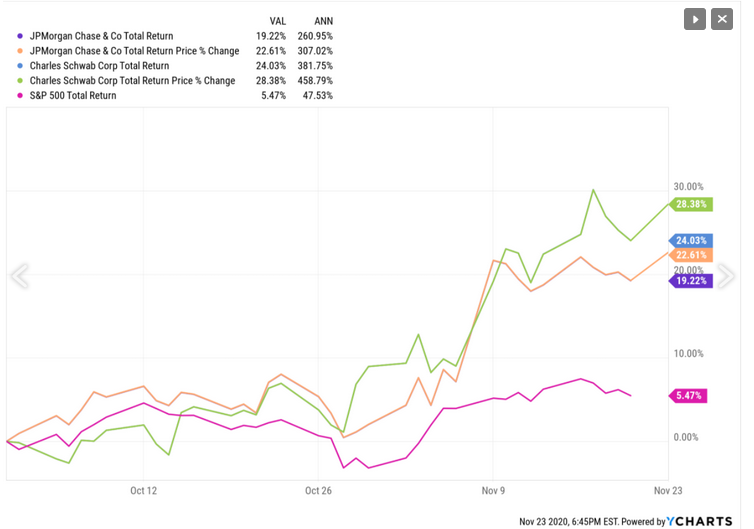
Here is the actual YTD returns of JP Morgan and Schwab since January ‘1 ’20:

No question JP Morgan and Schwab like many banks and financials have seen their shares rally since the start of the quarter on 10/1/20.
The next driver of potential positive EPS revisions for the banks and Financial sector could be a steeper yield curve (i.e. higher net interest income and a higher net interest margin), or even better, the Fed allowing banks to start repurchasing shares again.
JP Morgan has only repo’d $6.4 billion in shares in 2020—all in the first quarter before the lockdown hit—but repo’ed $24 bl in 2019 and close to $20 bl in 2018.
By a quick back-of-the-envelope calculation, JP Morgan should have closer to 2.8 billion shares outstanding as of 12/31/20 if the share repos had continued on schedule versus the 3.05 billion as of 9/30/20. Put another way, with 2.8 billion shares outstanding versus the actual 3.05 billion as of 9/30/20, JP Morgan’s Q3 ’20 EPS would have $3.21 versus $2.92 or 10% higher than actual.
It’s strictly a guess but it’s unlikely the Fed will probably allow share repurchases before the presidential inauguration in 2021 simply to let the new Administration settle in, and with Janet Yellen’s expected Treasury Secretary appointment, allow Jay Powell to become acclimated to the new order.
Expect the Fed to make some comment on share repos in the final weeks of December ’20 as they did in the September quarter, but readers should probably lower expectations for a resumption of share repurchases in the near future.
That being said, if you are watching bank earnings estimates, assume a 5%-10% increase in 2021 once the Fed gives the go-ahead for share repurchases.
Summary / conclusion: The two truly crushed sectors this year were Energy and Financials and while I remain skeptical on Energy (article coming on the sector), Financials still have upside in my opinion. The stocks have rallied sharply with the start of the 4th quarter and the top spreadsheet shows gradually improving growth rates through Q2 ’21.
The share repurchases for the banks are a big deal since the sector is very well capitalized. Citigroup (NYSE:C) which has never traded very well, remains below tangible book value of $71-$72 while Wells Fargo (NYSE:WFC) remains at a 10% discount to tangible book value of $30 per share. (Full disclaimer: I’ve never owned either of these stocks for clients for years, but for value investors, they remain appealing.) Even Goldman Sachs (NYSE:GS) which is owned for clients, has finally traded back to book value of $228-$229 per share as of today. If Goldman traded at JP Morgan’s premium to book value of 150%, it would well above $300 per share.
There is more to the sector than just big and regional banks too. You can own the exchanges like ICE (NYSE:ICE) or CME Group (NASDAQ:CME), or NASDAQ Inc (NASDAQ:NDAQ) or you can own what used to be a discount-broker but is now a substantial asset-gatherer like Schwab or Blackrock (NYSE:BLK), or you can own the traditional white-shoe brokers like Goldman or Morgan Stanley (NYSE:MS).
There are plenty of choices for investors in the sector. Clients' top two financial holdings are JP Morgan and Schwab, and then also in the top 20 are Goldman Sachs and Chicago Mercantile Exchange (CME). Also a small amount of Berkshire Hathaway Class B (NYSE:BRKb) is owned as well.
Evaluate all this in light of your own portfolio and your own risk profile. Markets change quickly. Higher interest rates might be a few years away and share repurchases might be a few quarter’s away, but improving credit losses and a vaccine puts the financial sector within the “recovery stock” category.
