
We make up a weekly medium-term trade list based on CFTC reports and technical analysis.
The overview provides a description of the technical condition of the market on the most popular financial instruments, as well as information on the large speculators’ actions according to the last COT reports and the previous period.
E-Mini S&P500 (ESH18)
The trend is bullish, another impulse wave develops. New pullback buying opportunities will be formed after the correction formation. Long positions will remain relevant until the market is above the nearest support level on the Daily timeframe, the lows of December 29 – January 2.
COT net position indicator reversed, large speculators are selling and hedgers are selling. Professionals’ opinion doesn’t correspond to the trend direction and it makes sense to reduce the position size when an entry point appears in the trend direction.
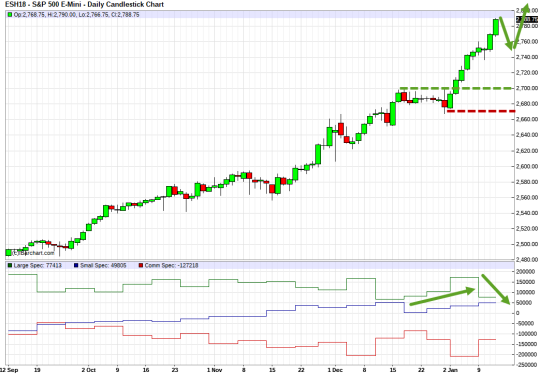
E-Mini S&P500 (ESH18). Technical analysis and COT net position indicator.
American dollar remains in the bear trendе. The market is actively falling and a pullback selling opportunity will appear after the correction formation. Short positions will remain relevant until the market is below the nearest resistance level on the Daily timeframe, the highs of January 9 – 10.
COT net position indicator decreases along with the market, CFTC reports indicate that large speculators are actively selling and hedgers are buying and the professionals’ opinion corresponds to the Daily trend direction.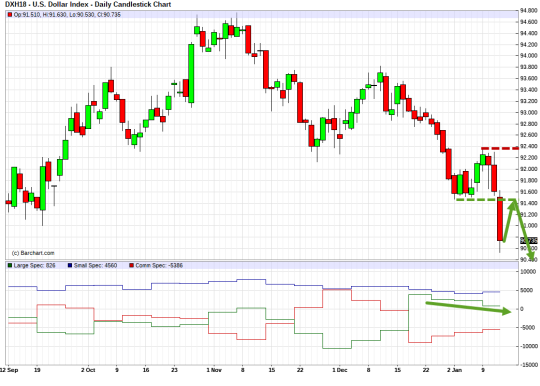
Dollar Index (DXY). Technical analysis and COT net position indicator.
Euro (EUR/USD)
EUR/USD currency pair broke through another resistance level on the Daily timeframe on Friday, the medium-term trend remains bullish and the impulse wave develops. A retracement may be formed soon and after it’s completion a pullback buying opportunity may be formed. Long positions will remain relevant until the market is above the support level, the lows of January 9-10.
COT net position increases, large speculators support the trend and hedgers are selling. Professionals’ opinion corresponds to the market technical picture.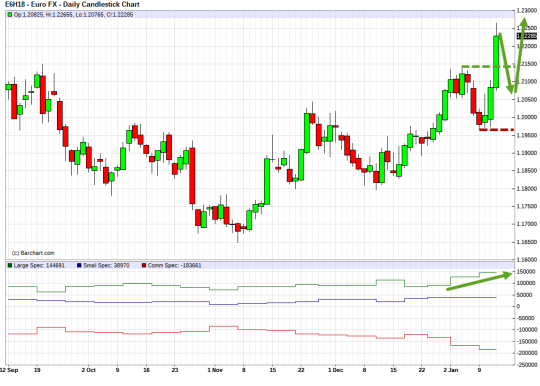
EUR/USD. Technical analysis and COT net position indicator.
Swiss Franc (USD/CHF)
USD/CHF currency pair remains in the medium-term bear trend. The correction came to an end last week. CFTC reports indicate that large speculators began to sell franc and hedgers began to buy. Professionals’ opinion doesn’t correspond to the Daily trend direction and it makes sense to reduce the position size when an entry point appears in the trend direction.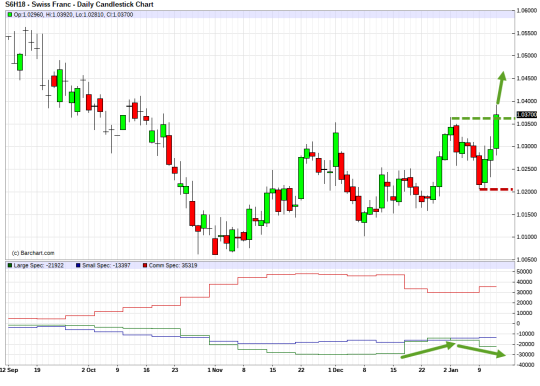
CHF/USD. Technical analysis and COT net position indicator.
British Pound (GBP/USD)
British pound broke through another resistance level on the Daily timeframe on Friday, the medium-term trend remains upward and the impulse wave develops. A pullback buying opportunity will appear after the correction formation. Long positions will remain relevant until the market is above the support level, the lows of January 10 – 11. CFTC reports indicate that large speculators go on buying Pound and hedgers are selling and the professionals’ opinion corresponds to the Daily trend direction.
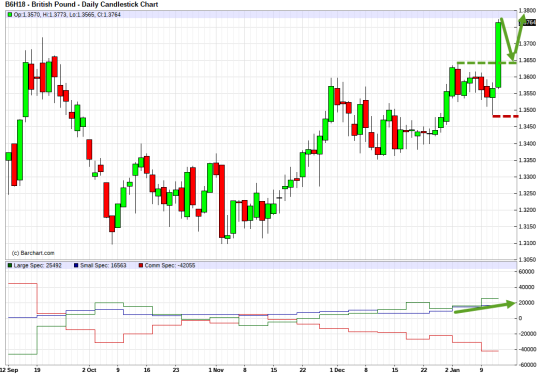
GBP/USD. Technical analysis and COT net position indicator.
Japanese Yen (USD/JPY)
USD/JPY currency pair broke through the support level on the Daily timeframe on Wednesday, the trend is bearish now and the impulse wave develops. A pullback selling opportunity will appear after the correction formation. USD/JPY short positions will remain relevant until the market is below the resistance level, the highs of January 8-9.
CFTC reports indicate that large speculators go on selling Yen and hedgers are buying and the professionals’ opinion doesn’t correspond to the Daily trend direction and it makes sense to reduce the position size when an entry point appears in the trend direction.
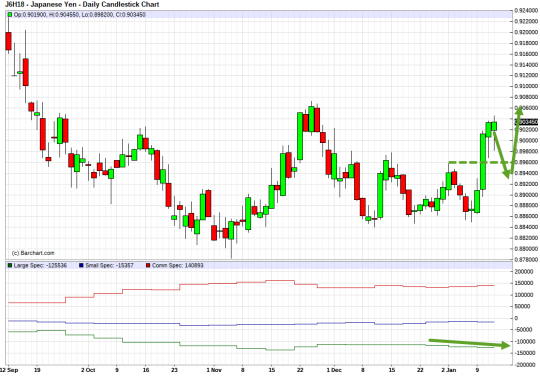
JPY/USD. Technical analysis and COT net position indicator.
WTI Crude Oil (CLG18)
The oil market remains in the active uptrend and a pullback buying opportunity will appear after the correction formation. COT net position indicator increases along with the market. Professionals’ opinion corresponds to the Daily trend direction.
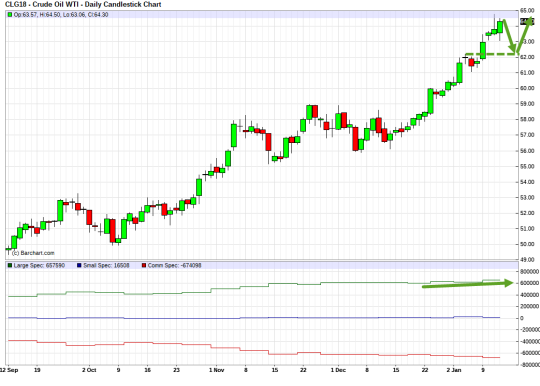
WTI Crude Oil (CLG18). Technical analysis and COT net position indicator.
Canadian Dollar (USD/CAD)
The Canadian dollar continues to strengthen. At the same time USD/CAD medium-term trend is bearish, another correction came to an end last week. USDCAD short positions will remain relevant until the market is below the nearest resistance level on the Daily timeframe, the highs of January 10-11.
CFTC reports indicate that net position of large speculators remained almost the same. Professionals’ opinion corresponds to the market technical picture and it makes sense to reduce the position size when an entry point appears in the trend direction.
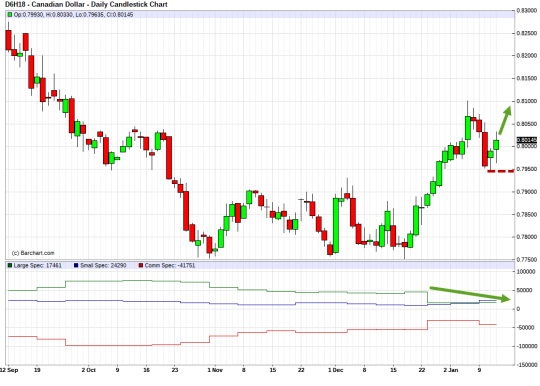
CAD/USD. Technical analysis and COT net position indicator.
Gold (XAU/USD)
The gold market remains in the uptrend, another resistance level on the Daily timeframe was broken on Friday and the impulse wave develops. A pullback buying opportunity will appear after the correction formation. Long positions will remain relevant until the market is above the support level, the lows of January 9 – 10. Large speculators go on buying and hedgers are selling and the professionals’ opinion corresponds to the technical picture.
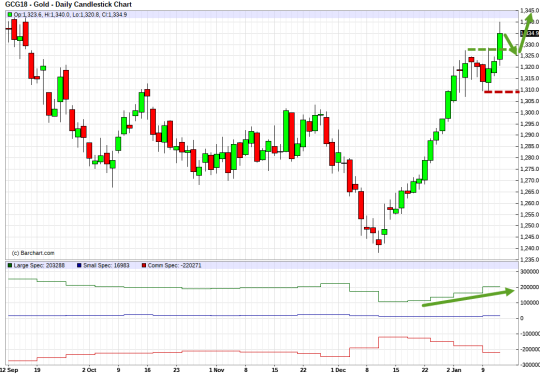
Gold (GCG18). Technical analysis and COT net position indicator.
Silver (XAG/USD)
The silver market is around the resistance level on the Daily timeframe. A pullback selling opportunity from this level will most likely appear within next week or it will be broken, the trend will change and a breakout buying opportunity will be formed.
Large speculators go on buying and hedgers are selling.
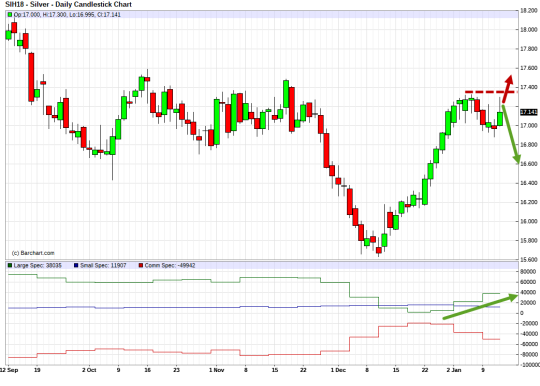
Silver (SIH18). Technical analysis and COT net position indicator.
Australian Dollar (AUD/USD)
The Australian dollar remains in the bull trend, another maximum on the Daily timeframe was broken on Thursday. A pullback buying opportunity on the Daily timeframe will appear after the correction formation. Long positions will remain relevant until the market is above the support level, the lows of January 9 – 10.
COT net position indicator reversed. Large speculators are actively buying and hedgers are selling. Professionals’ opinion corresponds to the Daily trend direction.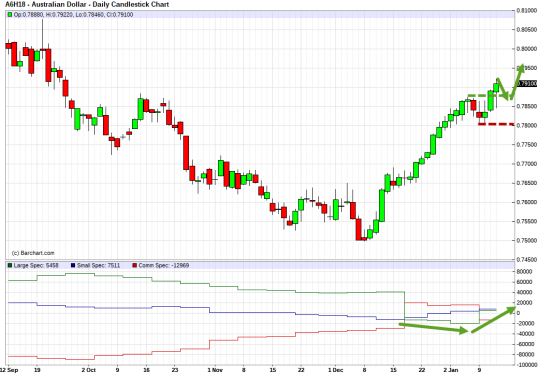
AUD/USD. Technical analysis and COT net position indicator.
New Zealand Dollar (NZD/USD)
The trend is bullish, the impulse wave develops. A pullback entry point will appear after the correction formation on the Daily timeframe. Long positions will remain relevant until the market is above the support level, the lows of December 20. CFTC reports indicate that professionals’ opinion corresponds to the market technical picture.
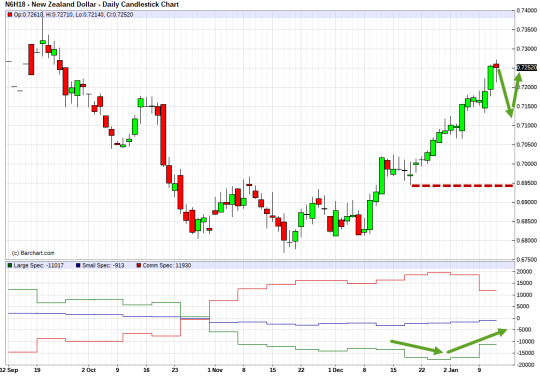
NZD/USD. Technical analysis and COT net position indicator.
Russian rouble (USD/RUB)
USD/RUB currency pair remains in the medium-term bear trend, the impulse wave develops. A pullback entry point will appear after the correction formation on the Daily timeframe. Net position indicator increases, large speculators go on buying Rouble and hedgers are selling and the professionals’ opinion still corresponds to the market technical picture.
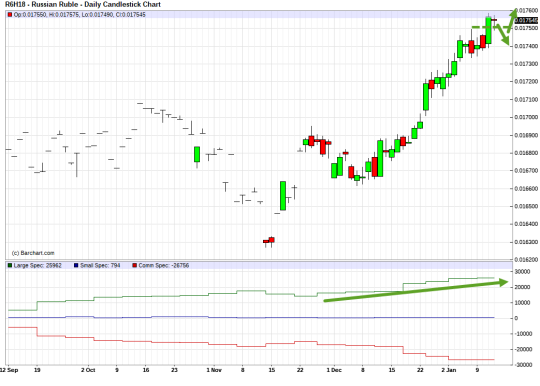
RUB/USD. Technical analysis and COT net position indicator.
Conclusions
In terms of medium-term trading, financial instruments with the correction close to completion on the Daily timeframe and with potentially the most promising risk-reward ratio are AUD/JPY, EUR/NZD, EUR/AUD, EUR/RUB.
In the near future AUD/CHF, AUD/CAD, NZD/CHF, NZD/CAD, GBP/NZD can become noteworthy depending on the market correction depth.
Other financial instruments in the trade list may be also interesting, but in these markets pullback signals on the Daily timeframe are likely to occur no earlier than a week.
Good luck in trading!