• Fed Chair Yellen takes center stage Fed Chair Janet Yellen is scheduled to deliver two important speeches this week. Today, before the Economic club of Washington, she is expected to address the pace of rate increases at which policy will proceed after a possible December liftoff. The following day, Fed’s Yellen is scheduled to testify before Congress’s Joint Economic Committee, where she will deliver a statement and answer questions. Even though she may leave expectations of the rate increase in place, the focus will shift on the pace of the hikes that will follow. Chair Yellen may also address how the policy divergence against other central banks may impact the dollar and how the Fed will manage this outcome. In particular, we expect her to comment on how a possible strengthening of USD, as a result of a rate hike, will hurt US inflation and exports, and what measures the Fed will take to counterbalance this.
• Overnight, the Australian GDP data for Q3 were released. Despite the country’s biggest trading partner, China, being in a slowdown, the Australian GDP managed to beat expectations for Q3. Exports were once again the main growth tool. However, with falling commodity prices, we could see a softer growth print in the upcoming months. The strong GDP could generate some further support for AUD in the near term, but we would sound a note of caution in the medium term, especially against USD.
• Today’s highlights: During the European day, the main event will be the Bank of Canada monetary policy meeting. At their last meeting, Bank officials decided to keep the benchmark rate unchanged as was widely expected, but in the statement accompanying the decision, they warned that lower prices for oil and other commodities will weigh more than expected on Canada’s economy. This has led to a modest downward revision to the Bank’s growth forecast for 2016 and 2017. Having in mind that oil prices have continued trading lower since their last meeting and the disappointing GDP data on Tuesday, I would expect the Bank to lower rates in the foreseeable future to support the economy, if not at this meeting. I expect them to maintain their dovish stance and to repeat that the “the past depreciation of CAD is roughly offsetting disinflationary pressures from economic slack, which has increased this year.” This could add selling pressure to the loonie.
• From Eurozone, the bloc’s preliminary CPI for November is due to be released. Expectations are for the Eurozone inflation to have accelerated from October. Given the encouraging German CPI data on Monday, there is a possibility for strong data here as well. Although this could benefit the common currency, the market reaction could stay muted as investors will most likely remain focused on the ECB meeting the following day. Eurozone’s PPI for October is also coming out.
• In the UK, we get the UK’s construction PMI for November. The figure is expected to have declined to 58.2 from 58.8 in October. Even though this is a moderate decline, given Tuesday’s disappointing manufacturing PMI data, we could see another weak reading. The slowdown in Q3 GDP was mainly attributed to a shrinking of the manufacturing and construction sectors, therefore the disappointment in the manufacturing PMI alongside a weak construction index could add to evidence that the the two sectors still weigh on Q4 growth. This could put the GBP under renewed selling interest.
• From the US, we get the ADP employment report for November, as usual two days ahead of the NFP release. The ADP report is expected to show that the private sector gained 190k jobs, more than it did in the previous month, when the print hit 182k. Although this would still be short of the crucial 200k level, Fed officials have stated recently that now that the labor market is improving, a below 200k reading could still warrant a rate hike. The final Unit Labour Costs Index for Q3 is also coming out and expectations are for the index to have slowed to +1.1% qoq, from its preliminary reading of +1.4% qoq. Although this indicator is usually not a major market mover, we will watch it closely going into the FOMC meeting, given the Fed’s emphasis on the employment data. Also, the Fed releases the Beige Book, which will give the FOMC anecdotal information about the US economy ahead of their policy meeting.
• We have five speakers on Wednesday’s agenda. Atlanta Fed President Dennis Lockhart, Fed Board Governor Daniel Tarullo, San Francisco Fed President John Williams and Fed Chair Janet Yellen who will deliver two speeches during the day. First, she speaks before the National College Fed Challenge Finals, and then she speaks before the Economic club of Washington. I believe that the latter speech will gain more attention, especially if she reiterates that the Fed could raise rates at the upcoming policy meeting.
The Market
EUR/USD corrects higher
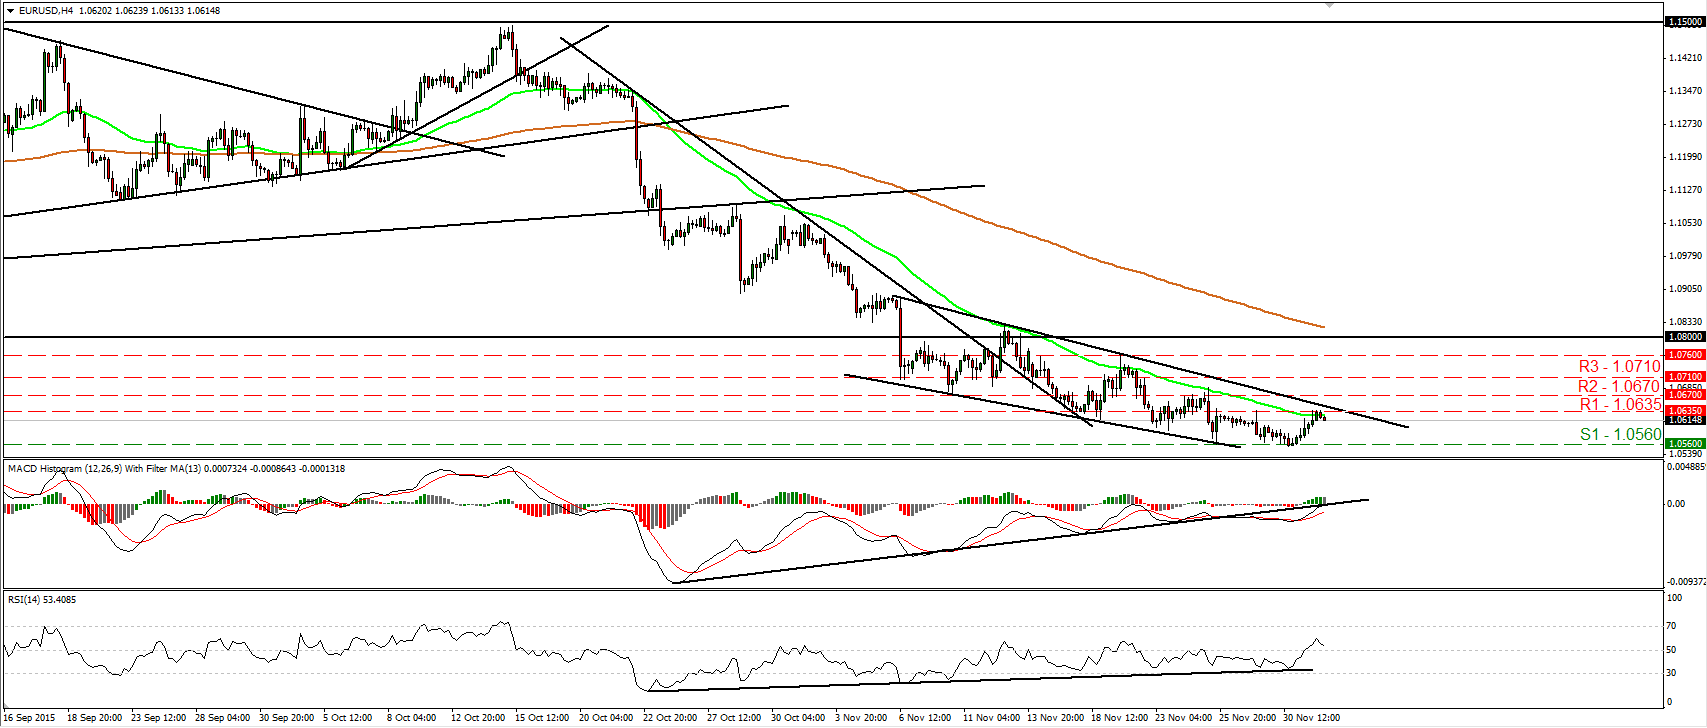
• EUR/USD traded higher on Tuesday, but the advance stayed limited below the downside resistance line taken from the peak of the 6th of November, near the 1.0635 (R1) barrier. The short-term trend remains negative in my view and therefore, I would expect the bears to take in charge again at some point and pull the trigger for another test at the 1.0560 (S1) support zone. A break below 1.0560 (S1) is the move that would confirm a forthcoming lower low and could perhaps open the way for the 1.0530 (S2) area, defined by the lows of the 13th and 14th of April. Our short-term oscillators support somewhat that the next wave is likely to be negative. The RSI has turned down and looks able to fall back below its 50 line, while the MACD shows signs of topping fractionally below its zero line. In the bigger picture, as long as the pair is trading below 1.0800, the lower bound of the range it had been trading since the last days of April, I would consider the longer-term outlook to stay negative. I would treat any possible near-term advances that stay limited below 1.0800 as a corrective phase.
• Support: 1.0560 (S1), 1.0530 (S2), 1.0500 (S3)
• Resistance: 1.0635 (R1), 1.0670 (R2), 1.0710 (R3)
USD/JPY could aim for the 123.75 line
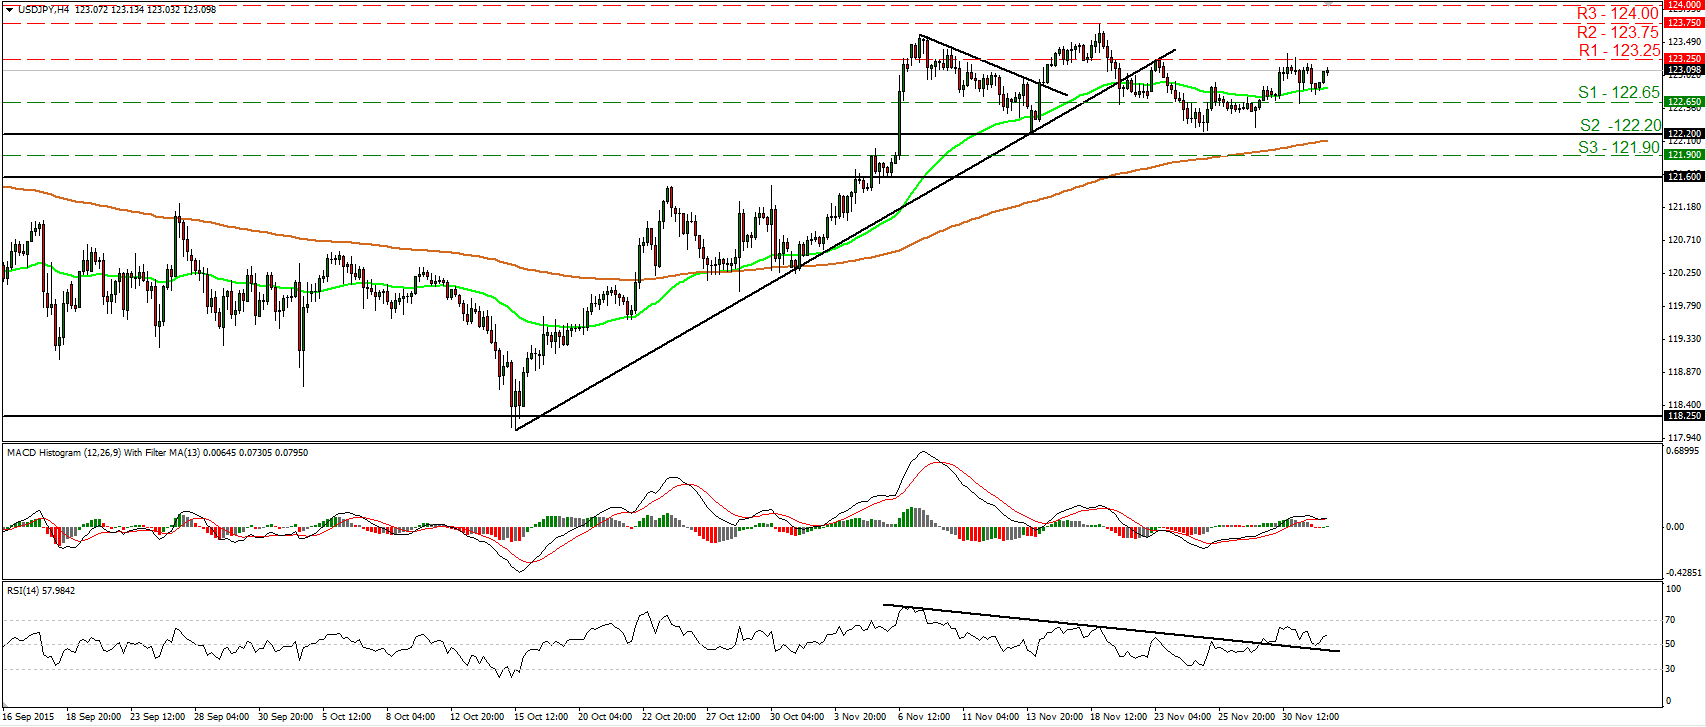
• USD/JPY traded somewhat higher during the Asian morning Wednesday after it found support slightly above 122.65 (S1). The rate now looks to be headed towards the resistance hurdle of 123.25 (R1), where a clear upside break is likely to open the way for the next obstacle of 123.75 (R2), marked by the peak of the 18th of November. Taking a look at our short-term oscillators, I see that the RSI rebounded from its 50 line, near its prior downside resistance line, and it’s now pointing up. The MACD stands above zero and looks able to rebound from near its trigger line. These indicators reveal positive momentum and support that USD/JPY is likely to continue higher, at least in the short run. As for the broader trend, the break above 121.60 on the 5th of November signaled the upside exit of the sideways range the pair had been trading since the last days of August and turned the longer-term picture back positive. This enhances my view that USD/JPY is likely to continue higher in the foreseeable future.
• Support: 122.65 (S1), 122.20 (S2), 121.90 (S3)
• Resistance: 123.25 (R1), 123.75 (R2), 124.00 (R3)
EUR/GBP rebounds from near 0.7000
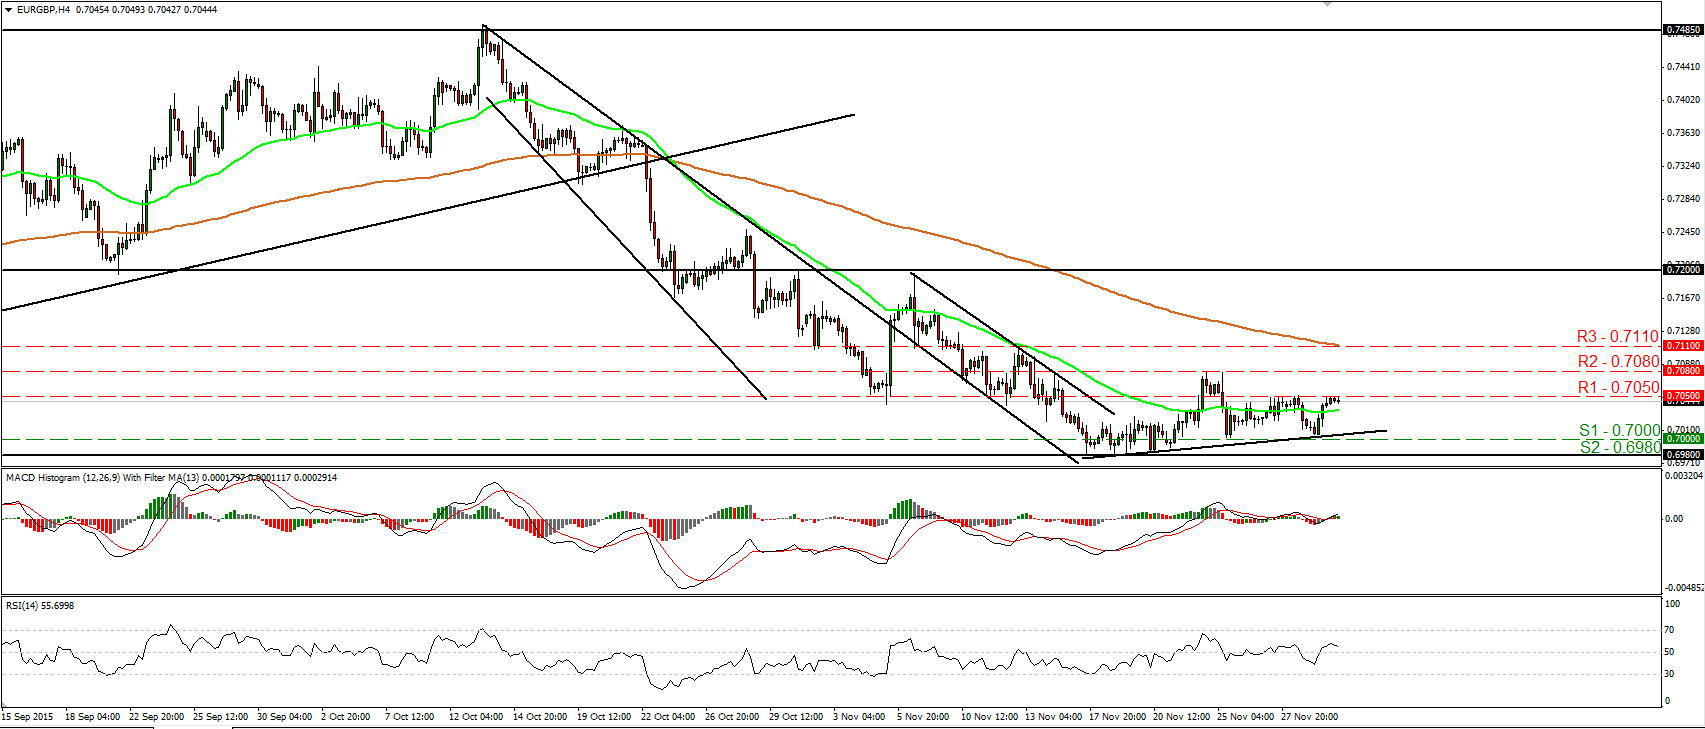
• EUR/GBP traded higher on Tuesday after finding support fractionally above the psychological line of 0.7000 (S1). However, the positive move was stopped by our resistance hurdle of 0.7050 (R1). As long as the rate remains between these two barriers, I would consider the intraday bias to stay neutral for now. Our short-term oscillators support my view to stay neutral for now at least as far as the near-term picture is concerned. The RSI oscillates around its 50 line, while the MACD gyrates above and below its zero line. Switching to the daily chart, I see that the dip below the 0.7200 area on the 28th of October has confirmed the negative divergence between the daily oscillators and the price action, and has also turned the medium-term picture back to the downside. Therefore, I would treat the moderate recovery started on the 18th of November from near 0.6980 (S2) as a corrective move for now. A clear close below 06980 (S2) would confirm a forthcoming lower low on the daily chart and could reinforce that medium-term downtrend.
• Support: 0.7000 (S1), 0.6980 (S2), 0.6950 (S3)
• Resistance: 0.7050 (R1), 0.7080 (R2), 0.7110 (R3)
Gold could still trade lower
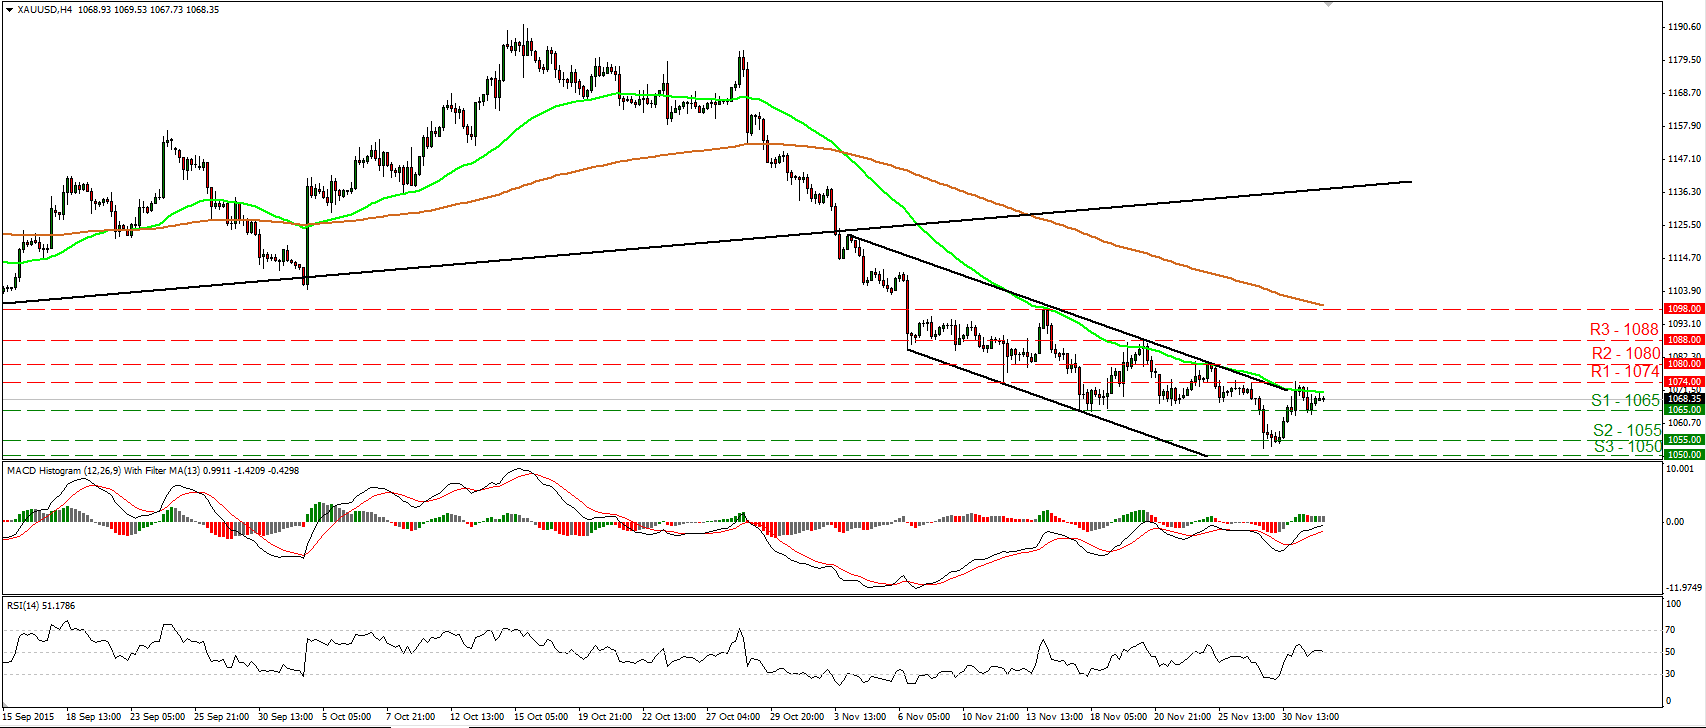
• Gold traded somewhat lower yesterday after it hit resistance near the 1074 (R1) line. However, the decline stayed limited near the support of 1065 (S1) and then the metal rebounded again. I believe that the metal is likely to turn down again at some point and I would expect a clear move below 1065 (S1) to open the way for another test near the 1055 (S2) obstacle. Our short-term oscillators support somewhat the notion. The RSI has turned down and looks ready to move back below its 50 line, while the MACD shows signs that it could start topping slightly below its zero line. On the daily chart, I see that the plunge below the upside support line taken from the low of the 20th of July has shifted the medium-term outlook to the downside. As a result, I believe that the metal is poised to continue its down road in the foreseeable future.
• Support: 1065 (S1), 1055 (S2), 1050 (S3)
• Resistance: 1074 (R1), 1080 (R2), 1088 (R3)
WTI could be headed for another test at 40.50
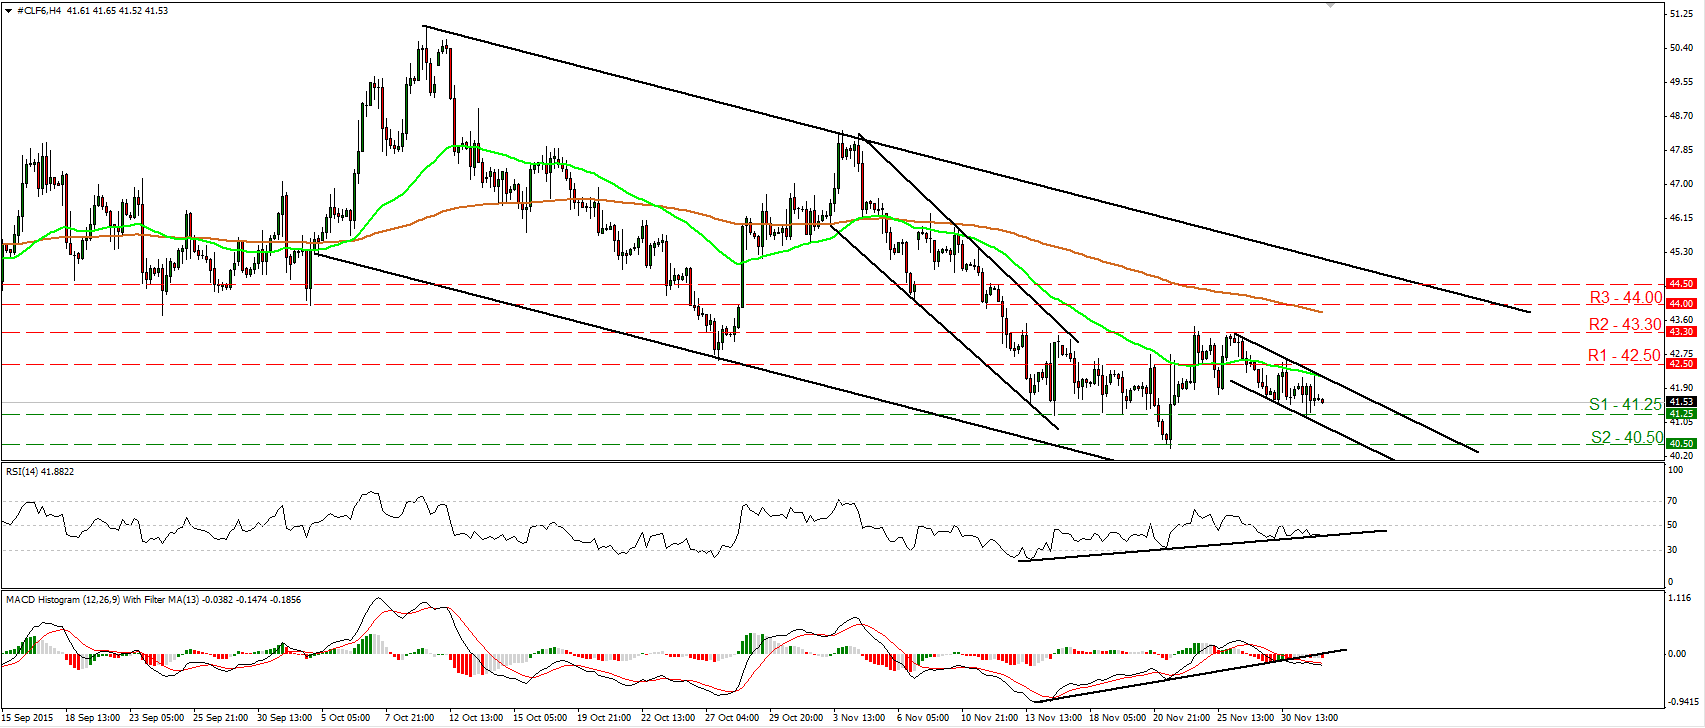
• WTI traded lower yesterday to hit our support line of 41.25 (S1). As long as the price is trading within the short-term downside channel that has been containing the price action since the 26th of November, I would consider the short-term bias to be negative. I believe that a clear move below 41.25 (S1) is likely to open the way for another test near the 40.50 (S2) barrier. Our short-term oscillators detect downside speed and corroborate my view. The RSI stands below its 50 line and looks ready to break below its upside support line, while the MACD, already negative, stands below its prior upside support line and below its trigger line. On the daily chart, WTI has been printing lower peaks and lower troughs within a downside channel since the 9th of October. Therefore, I would consider the medium-term outlook to be negative as well.
• Support: 41.25 (S1), 40.50 (S2), 40.00 (S3)
• Resistance: 42.50 (R1), 43.30 (R2), 44.00 (R3)

