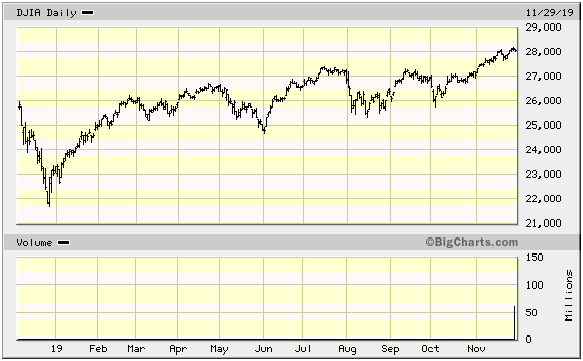
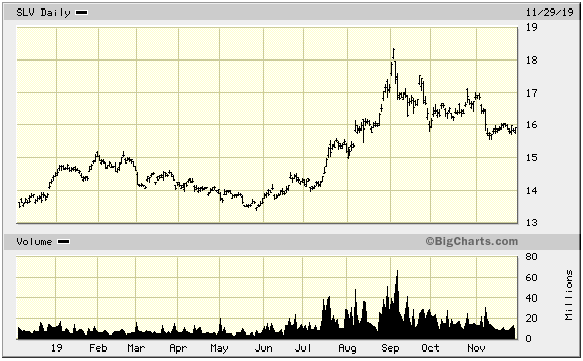
The risk is inordinately high that 2020’s top-to-bottom swing in the Dow could be 10,000 points, while silver’s trough-to-peak move could be $10. The analysis hereunder takes an abbreviated technical look at these markets.
Briefly, the fundamentals are summarized by super-valuation and the long term reversal in interest rates; the latter affects price-earnings multiples in a highly leveraged fashion.
Politically, a first-ever successful impeachment of a U.S. president could be the excuse for a shockingly swift decline.
Reiterating from the August report, there is a point at which the powers-that-be benefit from a market bashing since it creates the desired valuations for accumulating politically strategic assets in the global marketplace (i.e. – telecommunications, resources). In this scenario, those powers would be ambushing and betraying Trump who would have misjudged his creators’ interests.
Dow Jones 30: The Aug. 29, 2019 article reflected the view that the Dow had already peaked, or would conclude the year with trading bound by the upper trendline which connected the tops from December 2017 – July 2019.

In the case of a continued stock market advance which will have taken place during this year’s second-half, 2020 could portend utter calamity to levels which are, in fact, historically absurd anyway, though the magnitude of the decline from today’s nosebleed levels would usher in panic, both due to the size of the decline, as well as the speed with which it would occur.
I again remind that, per recent years’ activity, the magnitude of the index’s declines have generally increased off of each successive peak.
Expanding triangles within expanding triangles exist since the 1970s (a single such triangle suggests increasing volatility before a drive lower), thereby forming the background for the conclusion of the post-March 2009 major cycle 5-wave advance.
Significant cyclical support exists in the 18,000 – 20,000 area and, as I wrote in the August article, one may employ strategies that are not dependent on this event (see STRATEGY/CONCLUSION, below).
WARNING: At major cycle peaks, I have cautioned that blow-offs occur to nice round headline-grabbing numbers. In this case, 30,000 is such a number, just as 40,000 was the Nikkei’s number to watch 30 years ago. Included in the warning, note that a fancy number serves a “magnet” that is front-run by smart money.
Just as the Nikkei’s summit was just over 39,000 on the first day of 1990, could the Dow peak at a level somewhere between 29,000 - 30,000 during the first week of 2020?
Gold And Silver: From the August article:
“The inter-relationship of the patterns of the two metals confuses investors. The sole observation about which most all investors agree is that gold leads silver due to its liquidity. For trading and investing in these metals, the most important point, however, is that one may glean gold’s wave count by noting silver’s own Elliott pattern, since they are the same. This must be underscored.
“If one can correctly identify silver’s wave count, one would anticipate gold’s major movements..."
Consistent with the above, the relative power in gold is masking its true wave count, as corrections actually occur within up-moves. Silver, however, trades in a traditional manner. As we see from the chart below, silver’s decline from the September peak includes a wave-c sub-division that is timed to bottom perfectly with its 6-month cycle low at month-end.
In the past, however, when I have written of that cycle, the metal’s unorthodox (Elliott terminology) bottom occurred a month early, as it occasionally does, thereby putting in a higher price low that coincides with the time cycle bottom.

To truly hedge one’s conventional assets, while also being positioned to benefit from a potentially substantial multi-year rise in PM prices, one may contemplate using precious metals ETF options (i.e. – GLD, SLV) and precious metals equity index calls (i.e. – HUI, XAU), in conjunction with equity index options (i.e. – S&P, DIA), to efficiently reallocate exposure to PMs from ordinary (non-PM) stocks, by aiming to benefit from the outperformance of precious metals versus stocks.
Again from the August report:
“These asset classes’ asymmetric performance not only represents the very long term norm, but is also the condition by which one could enjoy exponentially increasing profits, owing to an eruption in these asset classes’ volatility premiums from their respective historic lows.
“Such a strategy would then equate to a highly efficient reallocation of assets from stocks to precious metals, particularly as little capital deployment would be required as compared to the volume of asset turnover required, if one were to sell stocks in favor of precious metals or their equity indices.”
In 2011, gold topped over 1900, having skyrocketed though its 1980 peak above $800. Silver, however, found its summit just under $50, thereby only double-topping with its 1980 (Hunt Brothers) blow-off (see STRATEGY/CONCLUSION, below).
STRATEGY
In deference for the forecasts expressed in the first paragraph of this article, one may contemplate the following defined-risk strategies:
DOW: I would advise being rid of non-precious metals-related equities and contemplate hedging strategies, certainly if the latter includes a mean by which to avoid losses in those hedging positions after market advances, and certainly if small profits could be enjoyed under those circumstances. Such a strategy could involve the use of put combinations which involve long and short contracts.
SILVER:
Speculators may consider the purchase of 2-year SLV calls ~15 – 20% out-of-the-money, as the 6-month time cycle is set to bottom at month-end, whether the price low is now or then.
Generally speaking, one may then look to write options that expire this year against the 2-year calls, sometime in mid-April or so. The written (sold) position may protect capital and even increase the investment’s leverage, depending on how the written position is subsequently managed.
