The US Treasury auctioned $255 Billion(!) of debt this week (including $38B 10-year Treasury bonds and $24B 30-year bonds), and the credit markets barely flinched. Until Thursday night/Friday morning when 10-year yields surged to a 14 month high of more than 1.63%.
Last August, the 10-year yield was at an all-time low of ~0.50%. (Falling bond prices in this chart = rising yields.)
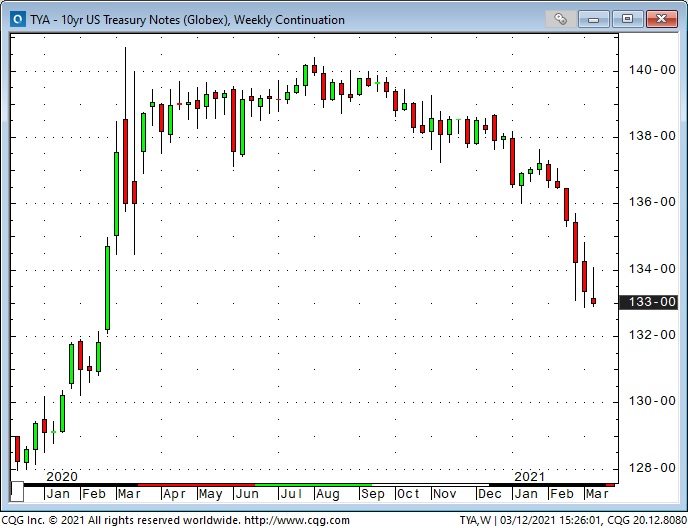
The prospect of a “stronger-than-expected” American economic recovery driven by aggressive fiscal policies and widespread vaccinations (and worries about rising inflation expectations) created a “sold-to-you” environment in the bond market Friday.
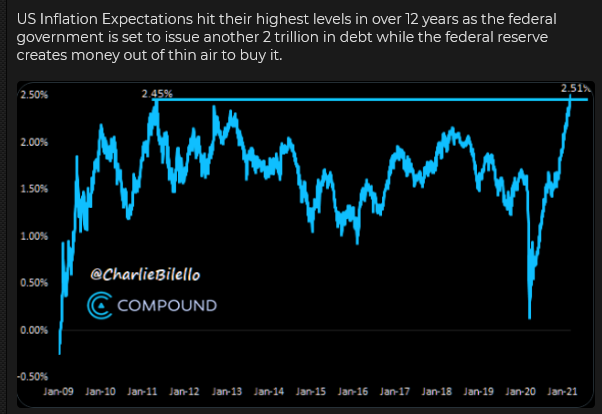
Bonds were big last year when the market assumed the Fed would be a Big Buyer Forever, but now some folks think that the Fed might start to taper their buying programs as early as next year.
Perhaps it is a “good thing” if bond yields rise on prospects of strong economic growth. Perhaps the Fed is “OK” with higher yields and rising inflation expectations. Maybe they hope higher interest rates will cool asset inflation (stocks and real estate), while a booming economy will create millions of new jobs. They may even be hoping that surging employment will create strong wage growth and narrow income inequality! Hallelujah!
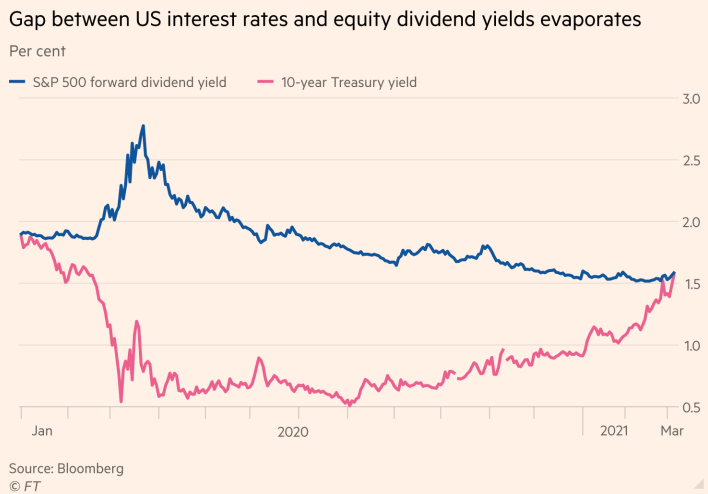
My view on ultra-low bond yields in my New Commodity Bull Market essay (written last December) was that bonds no longer serve their “purpose” in a 60/40 balanced portfolio, and therefore they will be sold. However, rising interest rates may become something of a “drag” on the stock market if only because Treasury yields are now higher than dividend yields. (This great chart is a week out-of-date.)
Stock indices on steroids
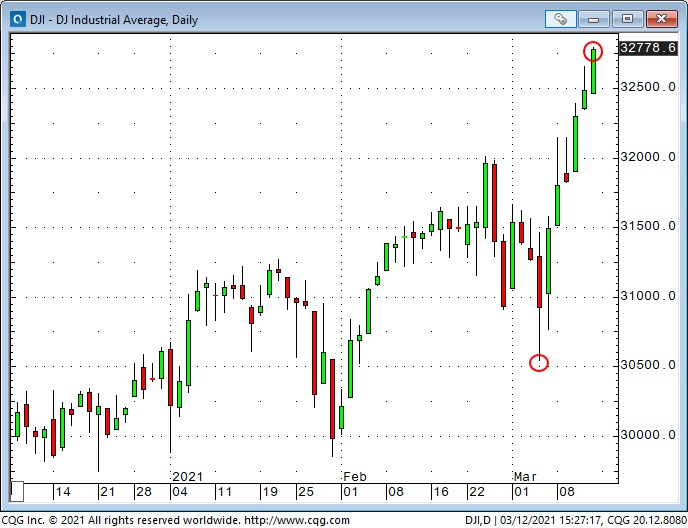
The broad stock market indices got a little weak-in-the-knees late February/early March as interest rates rose, but they came roaring back from last week’s lows this week despite the surge in bond yields.
The Dow Jones Industrial Average rallied over 2,200 points (~7.5%) from last Friday’s low to this Friday’s close!
The real “action” in the stock market the past few months has been sector “rotations,” as the “inside of the stock market” (link to terrific 3-minute Stan Druckenmiller video) changed in anticipation of stronger economic growth.
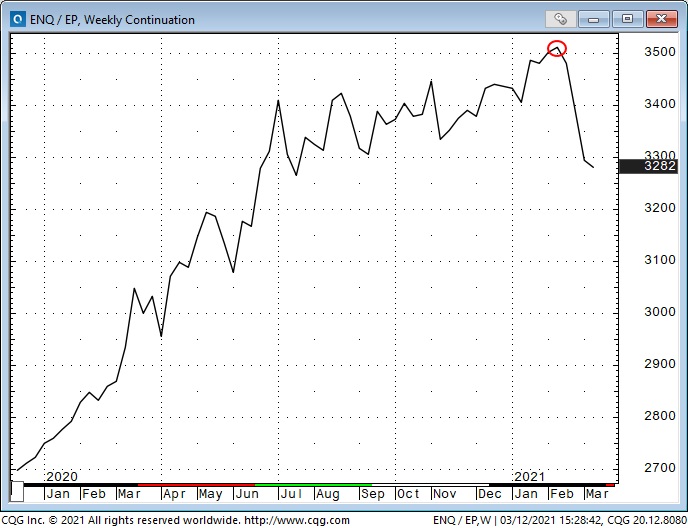
For instance, the NASDAQ has outperformed the S&P 500 for years, and that outperformance accelerated last year when interest rates tumbled to historic lows. (The Big Cap tech stocks are “long duration” assets that benefit from low bond yields.) When bond yields began to surge higher in February, the NASDAQ/S&P ratio “rolled over.”
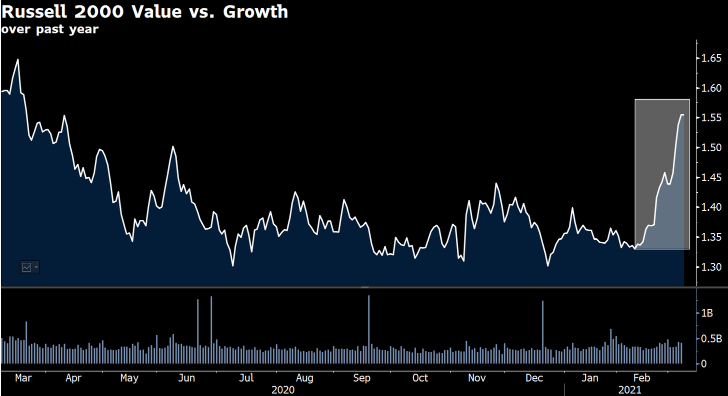
Another example of rotation between stock market sectors has been people buying value/selling growth since mid-February.
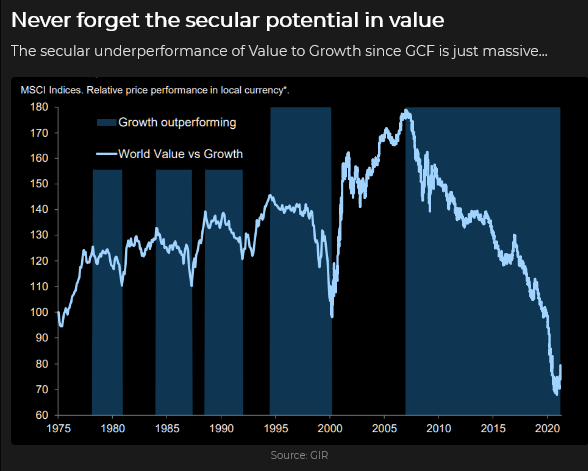
This second chart gives you a longer-term perspective on the value/growth relationship. That major low in value relative to growth in 2000 happened as the Dotcom bubble burst, and the NASDAQ began to fall like a stone.
Commodities
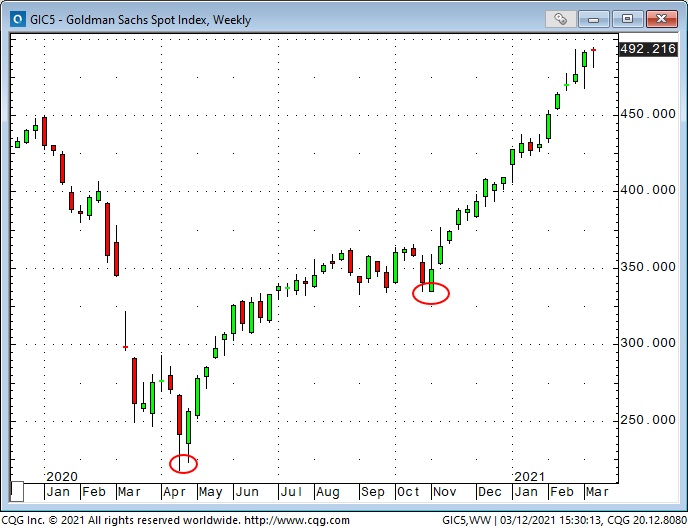
Commodity indices have rallied from the multi-year lows they hit last March. The benchmark S&P Goldman Sachs Commodity Index is about double where it was a year ago. Industrial metals, lumber, grains and particularly fossil fuels have contributed to the strength of the indices.
Currencies
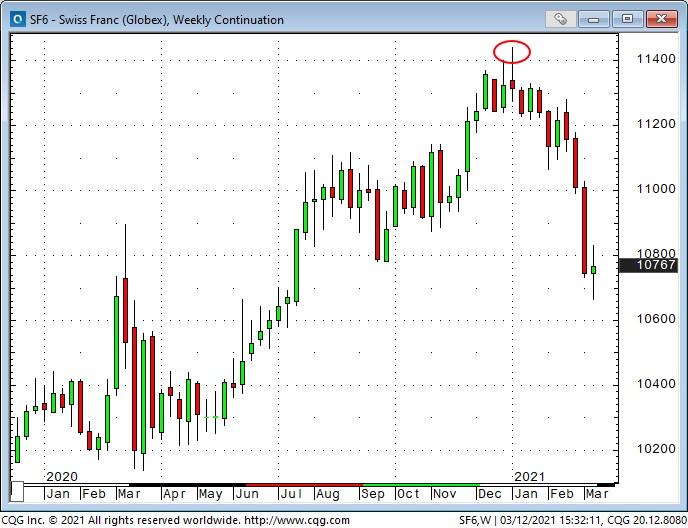
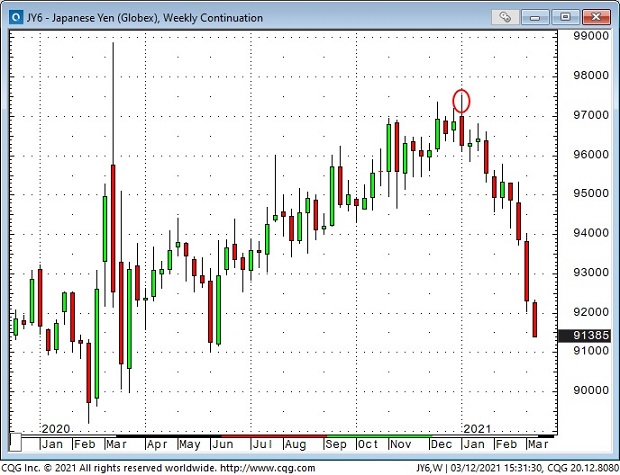
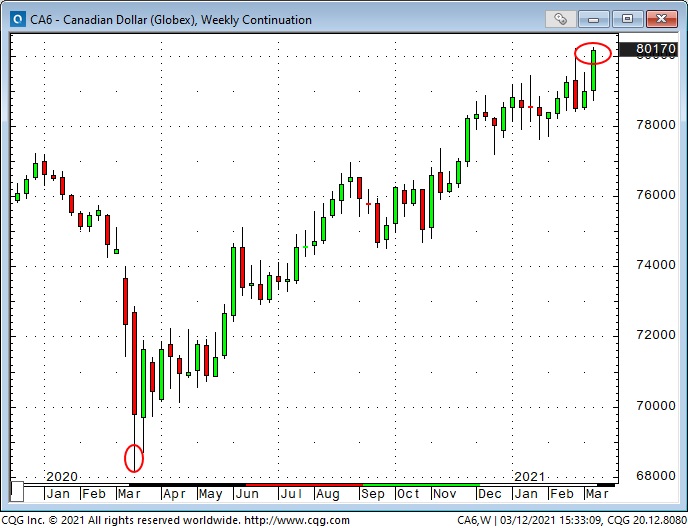
The US Dollar Index hit a 3-year low in early January after trending lower most of last year. It has bounced ~3% since the January lows, with most of those gains due to the Japanese yen and the European currencies’ weakness. The “com-dols” (CAD, AUD, NZD) have been steady/better this year after rallying with commodities since March of last year.
The yen and the Swiss franc are seen as “safe havens.” Apparently, the market hasn’t been interested in safe havens, YTD!
The Canadian dollar closed this week at its highest level in over 3 years.
Gold
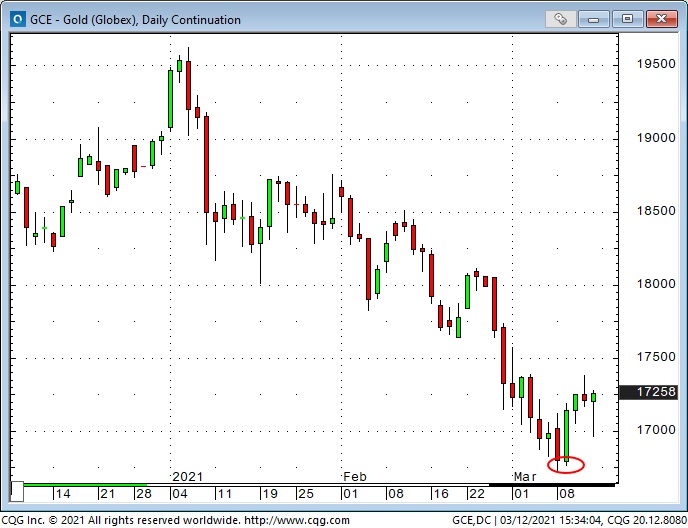
Gold hit All-Time Highs last August but hit a 10-month low Monday before bouncing as much as $65 to Thursday’s high.
Last week I wrote:
”Gold is a puzzle. Given inflation concerns, currency debasement concerns and soaring commodity markets, I thought gold would rally. I can’t believe it’s all about people deserting gold for cryptocurrencies. Maybe I’m wrong about that.”
In last week’s Gold Monitor, my good friend Dr. Martin Murenbeeld included this regression analysis of gold:
"Gold declined 9.3% this year to date (through March 4). To apportion this decline, 4.16% was due to a higher TIPS yield, 3.64% due to a higher dollar, and 2.38% due to a surging bitcoin."
In that same post, I also wondered if people had lost interest in gold, for now. Denis Roch sent me a note proposing that the weakness in gold the past few months may be due to a lack of “uncertainty” in the markets and that gold prices would rise if uncertainty returned. I agree.
My short term trading
I bought the Small Cap 2000 Futures Index the previous Friday (after trading the stock indices from the short side earlier in the week) because I was impressed with the strong market rebound Friday and thought that would lead to higher prices last week. I was dead-right on my expectations, and the Russell rose every day last week. Unfortunately, I liquidated my position Monday (with a nice gain!) and couldn’t bring myself to reload the position as prices surged higher!
I often tell people who ask about “the trading life” that it is essential to forgive yourself for making mistakes, errors, or missing a good trade. If you can’t do that, if you think you have to be “perfect,” then don’t try to make a living as a trader!
So I forgave myself for getting out of a good trade far too early—but I also tried to figure out why that happened. (Another aspect of “the trading life” is being very, very honest with yourself!)
I realized that I had moved my trailing stop too tight because I didn’t want to have a winning trade turn into a losing trade. I didn’t reload the trade because I have a “bias” that the stock indices (and many other markets) have been pushed to preposterous levels by rampant excess speculation, and they are at risk of nasty corrections.
My “bias” is clearly out of sync with current price action, and my experience tells me that it’s tough to make money shorting a bull market! So to clear my head, I went skiing with a buddy on Thursday! It was a bluebird day on the hill, and we skied hard for 5 hours. I planned to look at my charts over the weekend and hope to get back on track this week.
