“Don’t Stop Believin’” is the second single from Journey’s seventh studio album ‘Escape’ released in 1981. Although the song only reached #9 on Billboard Hot 100 and #62 in the UK Singles chart, the track became a timeless classic. Today, “Don’t Stop Believin’” can be heard at just about every wedding, high school dance, and Saturday night college bar you can think of. The popularity of “Don’t Stop Believin’” in modern times started in 2007, when the song was used in the iconic final scene of The Sopranos.
The core of the track—its infamous words and chords—comes from Cain (the Keyboardist). These words originated and still serve for him as a personal mantra. He first heard the words that would become the song on a phone call with his father.
At the start of his career in the 1970s, aspiring musician Cain was younger and struggling when his dog was hit by a car. Unsure about his future music career in Hollywood, he called his dad. He needed $900 for his dog’s veterinarian bill and a loan. He asked his father if his music career was merely “dreaming” and whether he should go back home to Chicago. His dad told him that he’d give him the loan but to stay right there in Hollywood: “Son, don’t stop believin’.” The rest is history…
Background Sources: Adam McDonald and Liam Flynn
While investing in Alibaba (NYSE:BABA) has felt like “taking the midnight train goin’ anywhere,” the exact opposite is true. Since the moment we put the first dollar to work in this asset we knew that the “sum of the parts” valuation was multiples of the whole. Every negative headline and exogenous event simply created the opportunity for us to increase our ownership percentage in the business and for management to buy in shares to increase OUR ownership in the business. Nothing has changed about the underlying business – and if anything, prospects have grown a lot brighter. We never stopped believin’…
On Tuesday, management made our life a little easier by beginning the process to unlock the value for owners on an accelerated pace when they announced this:
“Alibaba Group said on Tuesday it will reorganize into six business groups and other investments, a move designed to unlock shareholder value and foster market competitiveness.
The move marks the most significant governance overhaul in the platform company’s 24-year history and positions Alibaba’s businesses to capture market opportunities and further stimulate growth.
“The market is the best litmus test, and each business group and company can pursue independent fundraising and IPOs when they are ready,” said Zhang in an email to Alibaba employees.
The six business clusters will be:
-Cloud Intelligence Group
-Taobao Tmall Commerce Group
-Local Services Group
-Cainiao Smart Logistics
-Global Digital Commerce Group
-Digital Media and Entertainment Group
Daniel Zhang will continue to serve as Chairman and CEO of Alibaba Group, which will follow a holding company management model, while each of the six business groups will be managed by its own CEO and board of directors.
Each CEO will report to a board of directors and assume full responsibility for company performance. Zhang will also serve as the CEO of the Cloud Intelligence Group, as previously announced. This group will house all cloud, artificial intelligence activities, and businesses like DingTalk.
Goldman Sachs (NYSE:GS) stock analysts noted that Alibaba is trading at one of the steepest discounts to net asset value globally among holding companies and the investment bank expected the restructuring to help close the gap.”
As we’ve stated on previous podcast|videocast‘s when the fundamentals don’t make sense in the short term, we can look at technicals to point to our next targets. In the case of Alibaba we stated that the first target from here would be the 160-180 range – and it was likely no one would be let in. Why? Because everyone bought at ~$120 after the first 100% move off the Fall lows and got flushed back to $80. There will be no belief on the way up and the same chorus will sing, “Communists, Taiwan, WWIII.” The headlines are designed to separate weak handed holders from their ownership in the company and transfer it to people like us who gladly scoop it up when others mistake the noise of the day for the fundamental intrinsic, normalized earning power and moat of the business.
As we continue to say (borrowed from Michael Burry), “meet the new boss, same as the old boss (referring to Xi).” If you invest based on politics you will always lose. Many Republicans sold their portfolios at the 2009 lows because Obama was elected President. The bull market began. Democrats sold their portfolios after Trump was elected. They missed a two year rally led by tax cuts. Weak handed Alibaba shareholders puked in the hole in the Fall because somehow they thought covid or wrong-minded policies would last forever. At the end of the day, quality businesses (those with a history of compounding invested capital at rates above their cost of capital and above market returns) come out of “crises” stronger and with more market share than they came in. This time will be no different.
It reminds me of the beginning of covid when a reporter asked President Trump, “but what will happen to all of the restaurants?” To which Trump replied with a straight face, “don’t worry, they’ll still be there. They may have different owners, but they will still be there.” The same is true for Alibaba. Weak holders OUT, strong holders IN. Since we’ve covered the fundamentals many times over, here are our first technical targets, which are miles away from our final targets. $160 is on the basis of filling a gap, $180 is on the basis of a “measured move” from the “inverse head and shoulders.” How useful do I think these “techincal” targets are? Not very, but it gives us something to talk about while time arbitrage ultimately takes us up to “fair value.”
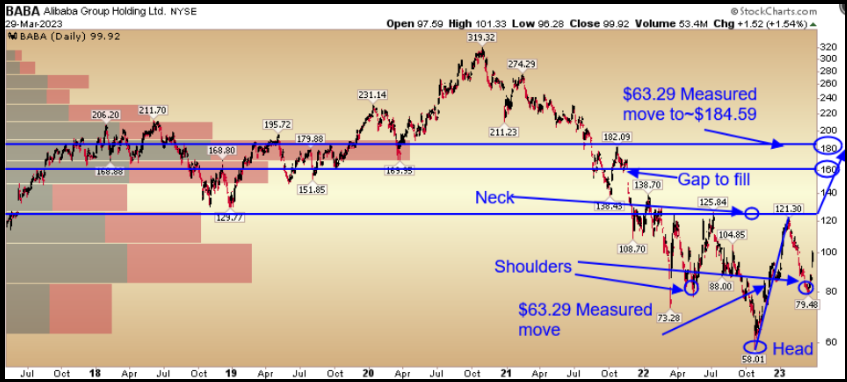
This analysis is slightly better than useless, but I would pay attention to the short term overhead supply between $160-180. This is where everyone will think the move is over because it will stall and pull back for months before making the long term move back to fair value.
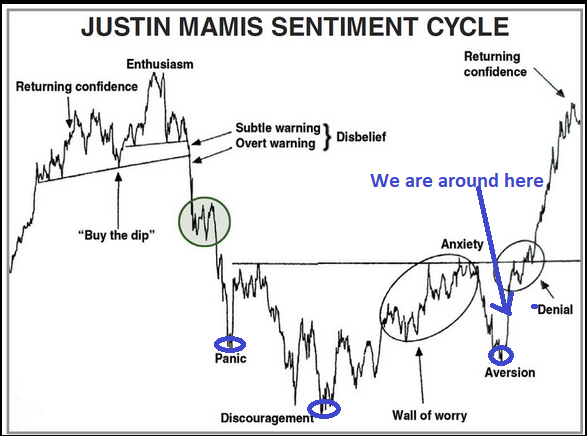
While technical analysis is a tool, it is not the answer. It is simply a guide to understand where you might be in the process. We find sentiment and positioning slightly more useful. In this case, the technicals are lining up perfectly with a standard emotional process cycle (by Justin Mamis). We have covered this chart many times in the past:
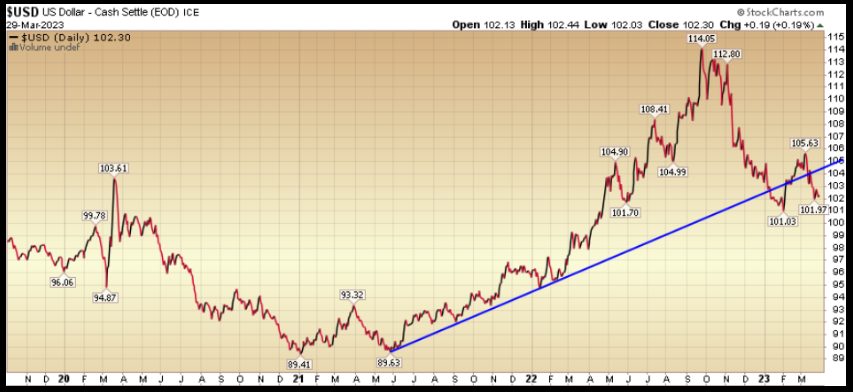
Keep in mind that the success of the Alibaba/Emerging Markets trade working is predicated on a weakening of the Dollar. We continue to get cooperation on this front and the stock has been cooperating since October (when the Dollar peaked):
Rates are also cooperating (10yr yield):
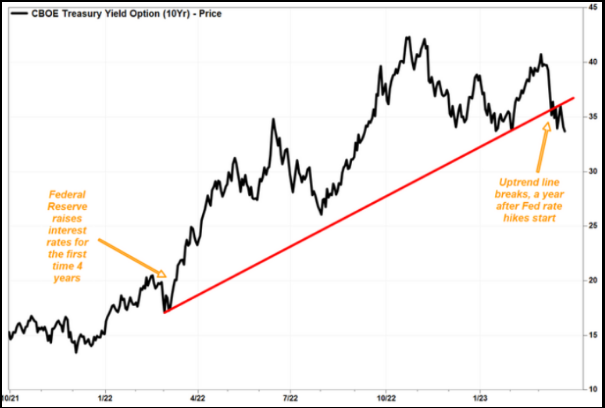
Source: MarketWatch
Intel (NASDAQ:INTC), which is a position we’ve initiated and covered in recent weeks’ podcast|videocast‘s, is also starting to move according to the same pattern (Mamis):
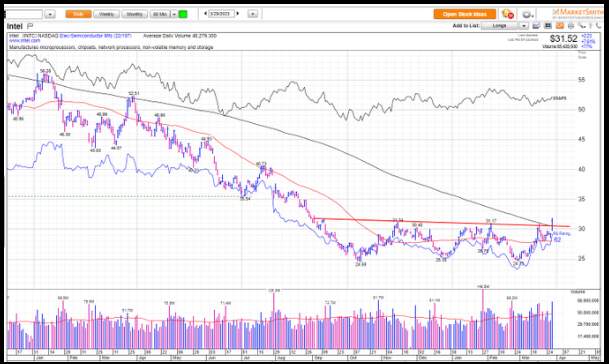
Chart Source: Mark Newton
What do we mean by fair value? I explained it in detail on two different segments on Tuesday:
Alibaba Valuation, Biotech, Market Outlook and more…
First, I joined Rachelle Akuffo at Yahoo! Finance shortly after the Alibaba announcement on Tuesday morning. Thanks to Pamela Granda and Rachelle for having me on:
Watch in HD directly on Yahoo! Finance
Later in the day I joined Kristen Scholer on Cheddar News at the NYSE (a very special place). Thanks to Ally Thompson, Joe Kohle and Kristen for having me on:
I always love going back to the NYSE. My first ever TV hit was almost four years ago in 2019 – live from the NYSE – for Fox Business. Ellie Terrett was the Fox Business producer who “took a chance” on me – along with legendary anchor Liz Claman! I’m always grateful to them for doing that…
I joined Liz on Friday to discuss the banking crisis and one new position idea. Thanks to Jake Mack, Kathryn Meyers and Liz for having me on:
Watch in HD directly on Fox Business
As you can see in the first two segments (FROM TUESDAY), what we covered live was different than originally planned (show notes below) – given the historic announcement for Alibaba:
Markets Overview: Positioning and Sentiment
Bank of America (NYSE:BAC) Global Fund Manager Survey
At levels seen at/near market lows:
- Investors more bearish than: Pandemic Low (2020), Euro Debt Crisis Lows (2011), and GFC lows (2009).
- Recession fears have come off highs as they did post March 2009 and April 2020 (after market bottoms).
- Cash allocations coming down but still elevated – similar to levels after previous bottoms.
- Managers still overweight Bonds/Cash and Underweight US Equities and Tech.
Source: Bank of America
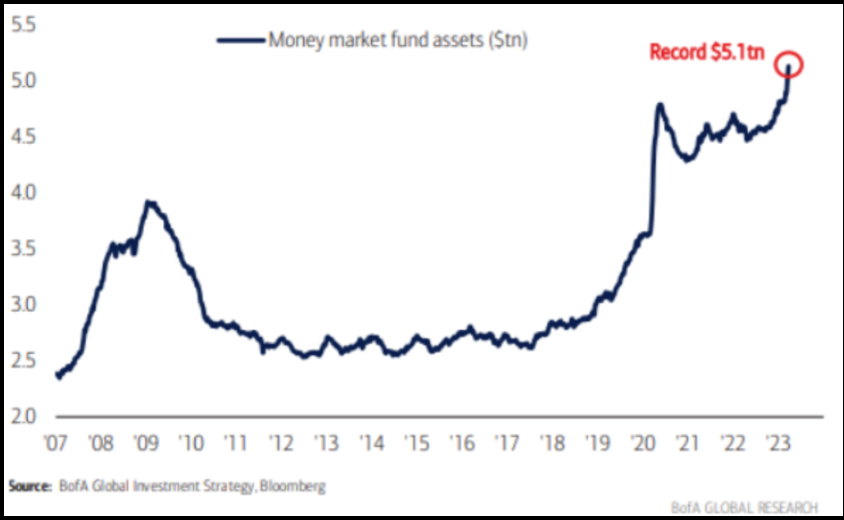
MARKETS DON’T TOP WHEN MANAGERS ARE OVERWEIGHT BONDS AND CASH. THEY TOP WHEN EVERYONE IS OVERWEIGHT STOCKS WITH LEVERAGE AND THERE ARE NO MARGINAL BUYERS LEFT. WE ARE NOWHERE NEAR THIS LEVEL.
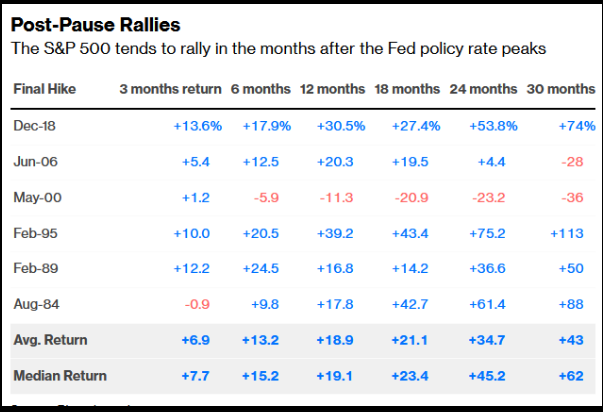
FED 0-1 more hike means rates subdued.
Source: Bloomberg
What works when tightening cycles are ending and growth is below trend?
Healthcare Theme (3 picks) 12-24 month outlook:
Pick 1:
-Basket of biotech (XBI). Fed at or near end of tightening cycle. XBI Bottomed in May, traded sideways for months. Recent retest/pullback will hold.
We believe the move is just beginning and should be strong over next 1-2years (in a slower GDP growth environment). Similar situation in 2015-2018 (crashed 50% due to tightening cycle, up ~135% over next 2 years off low).
-Besides historic low valuations – whether you look at Price/Sales, Price/Book, Price/Operating Cash Flow, Forward P/E, Percent trading at a discount to cash, etc the key catalysts are drugs and deals. Pfizer (NYSE:PFE) buying SGEN for $43B was tip of iceberg.
BofA quantitative study of where Biotech stocks are trading as a group (relative to their historic average multiple) implies the sector should appreciate:
>25% – to get back to average Price to Book multiple
>155% – to get back to average Price to Operating Cash Flow multiple.
>110% – to get back to average Forward P/E multiple.
Big Pharma has record cash and patent cliffs. Will have to buy innovation and growth. The cash balance of Russell 3000 Health Care companies exceeds $500B. This is up ~400% in the past 20 years.
Drug approvals have been coming in fast and furious since the focus has shifted from COVID (2020-2022) back to normal innovation (Alzheimer’s, Cancer, etc).
Pick 2:
-Baxter International (BAX): Medical Devices – Stock Down 55%. Trading ~12x 2024 vs. avg PE 19x.
-Why down: Absorption of 12.4B Hillrom Acquisition. Supply chain and inflation headwinds should continue to improve. Synergies will be realized over time.
-Double-digit compounder of capital ROIC over time. Will continue.
-Unlock Value: spin-off of renal and acute care business. Possible sale of biopharma.
Pick 3:
-Centene (CNC): Health Insurer (aids government programs 65% medicaid, 30% medicare).
-Insider Buying: Everyone hates the stock except the CEO Sarah London who bought ~$1.9M of stock 10 days ago. CFO and COO each bought ~$500k and a director bought ~$500k in the past month.
-Last quarter continued momentum within its Medicare
(+24%) and Medicaid (+8%) business segments.
-Trading at 9x 2024 EPS vs. avg. 14x. Double digit earnings growth, single digit multiple. Right group at the right time…
More Data…
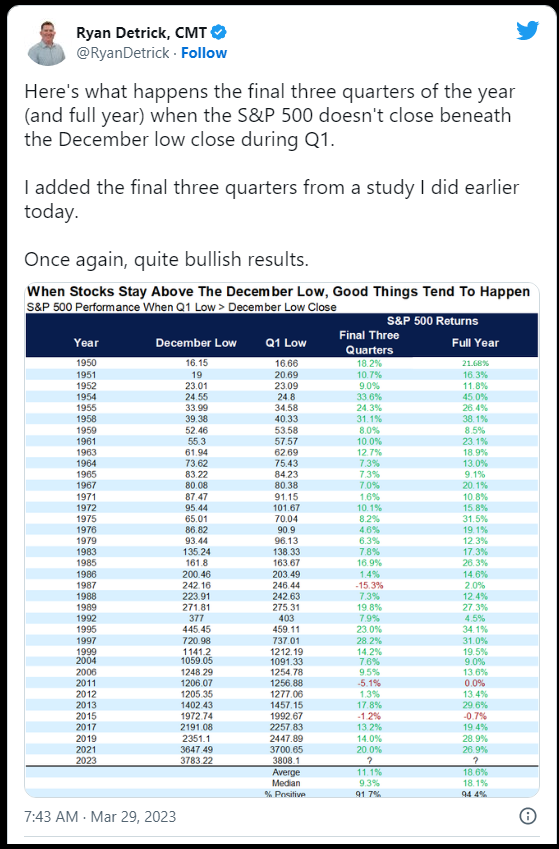
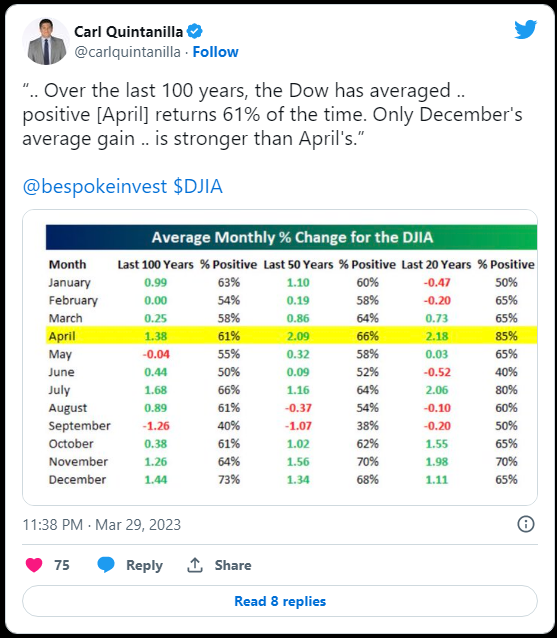
Now onto the shorter term view for the General Market:
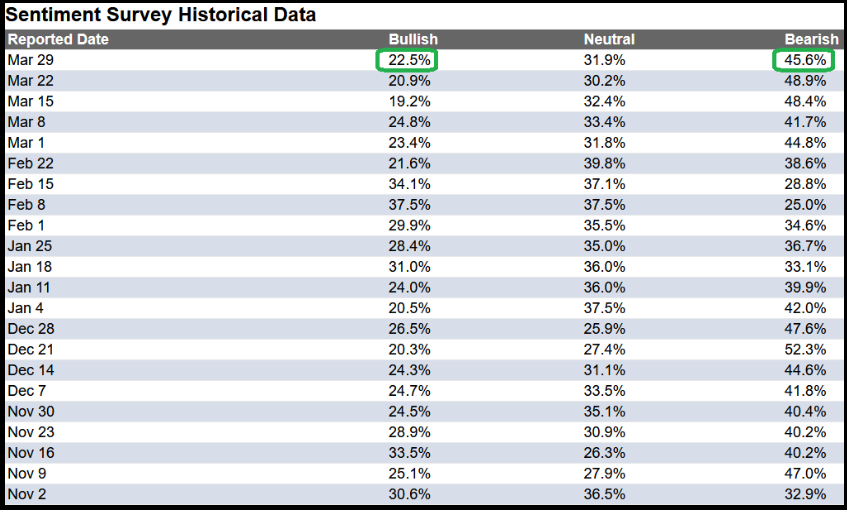
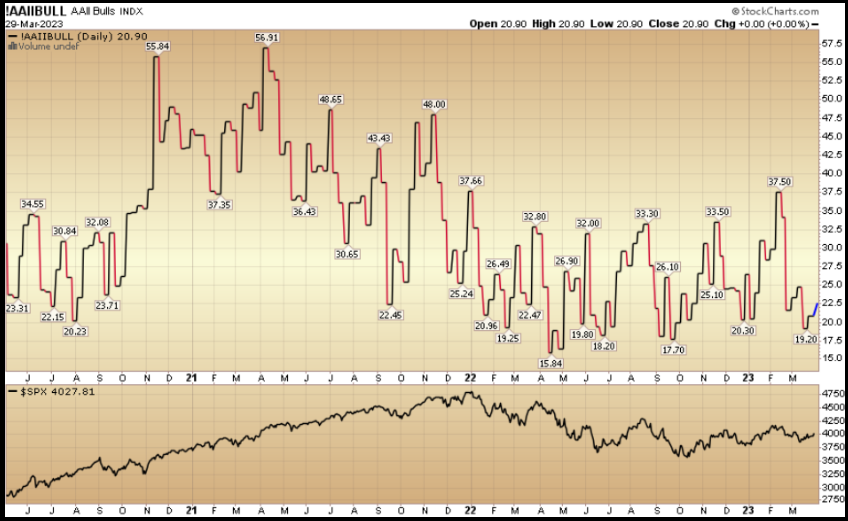
In this week’s AAII Sentiment Survey result, Bullish Percent (Video Explanation) ticked up to 22.5% from 20.9% the previous week. Bearish Percent ticked down to 45.6% from 48.9%. Retail traders/investors are still petrified…
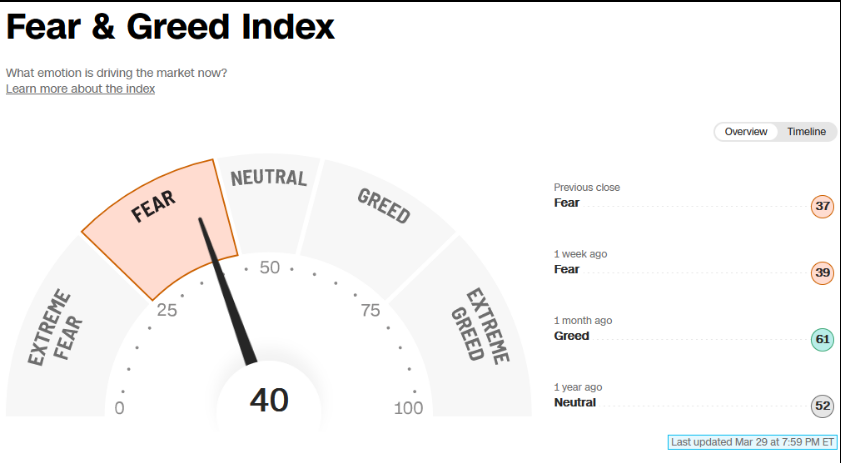
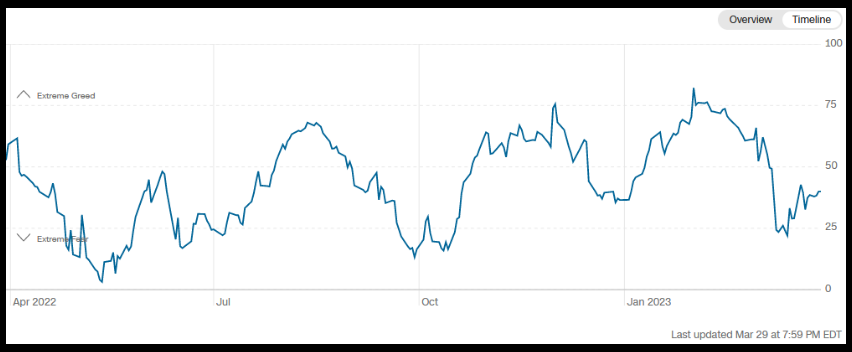
The CNN “Fear and Greed” rose from 37 last week to 40 this week. Sentiment is still fearful. You can learn how this indicator is calculated and how it works here: (Video Explanation)
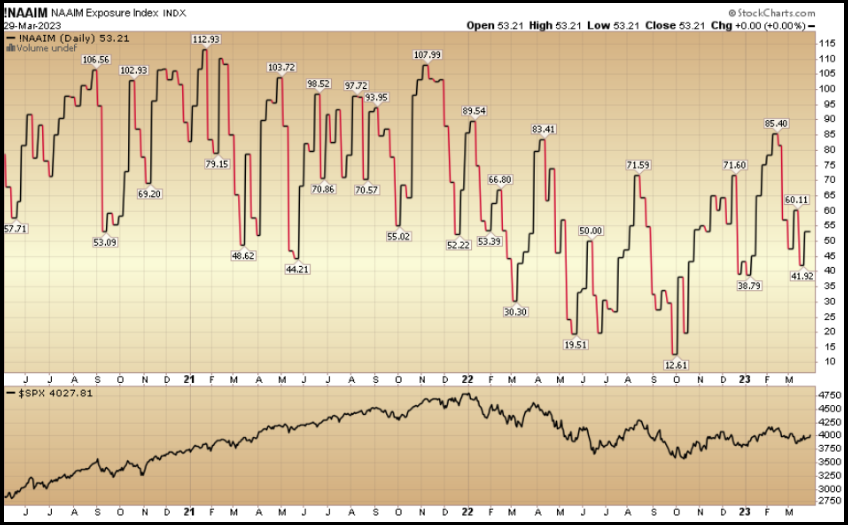
And finally, the NAAIM (National Association of Active Investment Managers Index) (Video Explanation) rose to 53.21% this week from 41.92% equity exposure last week.
This content was originally published on Hedgefundtips.com.
