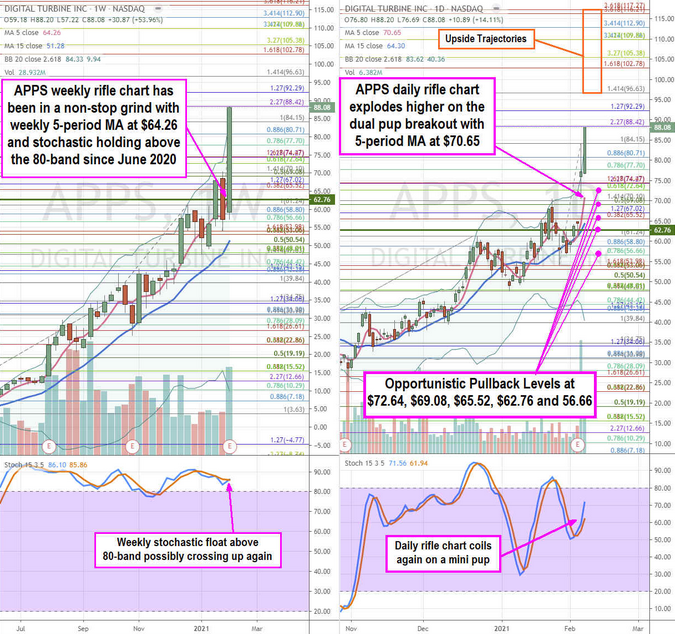
Mobile advertising and content technology platform provider Digital Turbine (NASDAQ:APPS) stock has been on an explosive rise propelled by the increase in mobile device usage and economic recovery. The stock is a dual narrative winner benefiting from stay-at-home, ecommerce and mobile app entertainment trends spurred by the pandemic as well as the recovery in advertising fueled by the economic recovery.
While smartphone sales are flat, engagement with mobile devices has grown during these times. Digital Turbine benefits from both app engagements and the rising rates advertisers are willing to pay for those engagements. The Company has solidified itself as a single marker maker between the carriers and advertisers through its platform and taking a nice piece of the action on a recurring basis. Investors looking for exposure should avoid chasing but rather monitor for opportunistic pullback levels.
Q3 2021 Earnings Release
On Feb. 3, 2021, Digital Turbine released its fiscal third-quarter 2021 earnings report for the quarter ending in December 2020. The Company saw an earnings-per-share (EPS) profit of $0.21, excluding non-recurring items, versus consensus analyst estimates for $0.18, a $0.03 beat. Revenues rose 146% year-over-year (YoY) to $88.59 million beating consensus analyst estimates for $75.86 million. The Company attained a $100 million credit facility with Bank of Amercia, with an accordion feature that raises it up to $200 million to be used for acquisitions and general corporate purposes.
Conference Call Takeaways
Digital Turbine CEO, Bill Stone, provided color on the quarter:
“… revenue per device RPD is a core operational health metric of our business and in the U.S. strong media demand resulted in 25% growth of RPDs and we saw nearly 70% growth in international RPDs.”
International supply revenues grew by nearly 200% YoY indicating the international demand out paced U.S. for the first time. The Company added 65 million more devices in the quarter, a 50% YoY spike. Most impressive was that this was accomplished despite the drop in Android devices underscoring the strength of the Company’s penetration momentum. December revenues rose 100% YoY driven by the full deployment of the new content platform resulting in over 10 million daily active users (DAUs).
CEO Stone further noted:
“I’m pleased to announce that we anticipate multiple Tier-One partners to launch some of our content products later this year, which should materially improve our DAU counts and driver revenue synergies from our Mobile Posse acquisition last year.”
The Company continues to collaborate with U.S. based carriers but sees amazing growth with international carriers which have see 100% YoY revenue increases with an annual run rate exceeding 200% YoY. The SingleTap product now has 50% recurring revenues, up from 10% YoY growing into a “seven figure” monthly business. Clients include range from Uber (NYSE:UBER), Pinterest (NYSE:PINS) to McDonald’s (NYSE:MCD) to TikTok and Alibaba (NYSE:BABA).
Full-Year 2021 Guidance Raise
Digital Turbine raised its full-year 2021 EPS guidance to $0.67 versus $0.63 consensus estimates. The Company sees full-year 2021 revenues in the $298 million to $300 million range compared to $280.37 million analyst estimates. With shares in a parabolic rally, prudent investors should consider waiting for opportunistic pullback levels to seek exposure.

APPS Opportunistic Pullback Levels
Using the rifle charts on the weekly and daily time frames enables a near-term view of the price action playing field for APPS stock. The weekly rifle chart has gone parabolic with the 5-period moving average (MA) support rising at $64.26 and upper Bollinger Bands (BBs) near the $84.15 Fibonacci (fib) level. The weekly stochastic has held above the 80-band since piercing through it in June 2020. The weekly stochastic formed a divergence top as a bearish mini inverse pup appeared to trigger as stochastic briefly fell under the 80-band in November 2020 as shares fell under the $26.61 fib. However, the shares rocketed higher on the earnings reaction to squeeze up towards the $70.10 fib as another weekly stochastic divergence top attempted to form until the recent Q4 2020 earnings exploding shares to the $88.42 fib. The daily rifle chart formed a market structure low (MSL) trigger above $62.76 as it formed a pup breakout on the stochastic mini pup. The daily 5-period MA support is rising at $70.65 as shares exceed the upper BBs at $83.62. Prudent investors can watch for opportunistic pullback levels at the $72.64 fib, $69.08 fib, $65.52 fib, $62.76 fib, and the $56.66 fib. The upside trajectories range from the $96.63 fib up to the $117.27 fib level.
