

VIX consolidated for a second week, closing beneath Long-term resistance at 16.49. The Cycles Model suggests Cyclical strength may dominate through the first week of June. There is a strong likelihood that VIX may rally to the December high as a minimum.
(Bloomberg) There’s the trade war, the escalating conflagration in Washington, near-anarchy in the U.K. and tensions in the Middle East. Add perceptions of a stiffening Federal Reserve and signs global economic growth is softening and it’s a recipe for price-screen red.
“It’s sort of like Whack-A-Mole,” said Katie Nixon, chief investment officer at Northern Trust (NASDAQ:NTRS) Wealth Management, which manages $294 billion. “The trade issue goes off the front page, back comes Brexit. Geopolitical risk remains second to the Fed policy risk. Our greatest risk case is that these things start to manifest in actual economic events and earnings events.”
SPX bounces between support and resistance

SPX declined to challenge Intermediate-term support/resistance at 2832.04, bouncing back toward weekly Short-term resistance at 2879.28 before closing beneath Intermediate-term. The market has a memory as it had tested the January 26, 2018 high and failed, leaving it in a weakened condition. A sell signal has been generated beneath Short-term support. “Point 6” lies beneath the December 26 low.
(CNBC) Stocks rose on Friday, but notched weekly losses as investors worried the U.S.-China trade war is hurting economic growth.
The Dow Jones Industrial Average ended the day up 95.22 points at 25,585.69 while the S&P 500 climbed 0.1% to 2,826.06. The Nasdaq Composite rose 0.1% at 7,637.01. The indexes rebounded slightly from sharp losses on Thursday after President Donald Trump said Thursday afternoon the ongoing trade war could be over quickly.
NDX slides beneath Intermediate-term support

NDX suffered the third week of losses as it declined beneath Intermediate-term support at 7359.28. The Orthodox Broadening Top appears to be the primary formation. Cyclical strength indeed ran out as expected and may continue through mid-July.
(NorthmanTrader) Remember all that talk of optimism in Q1 and into April? It came easy after markets rallied hard following the Fed caving. The Q1 slowdown was just temporary, it’s going to be like early 2016, easy Fed is all that matters.
Besides, a trade deal is just around the corner. Don’t you know? Look at all those ‘trade optimism” headlines.
Bollocks. All of it. It’s called complacency and price driving sentiment.
The slow down did not end in Q1, it continued and perhaps accelerated also into May.
High Yield Bond Index tests overhead resistance

The High Yield Bond Index bounced up to test Short-term resistance at 210.08, then fell beneath Intermediate-term support/resistance at 207.62. A sell signal has been confirmed. Point 6 may be the Cycle Bottom at 162.48. The Cycles Model warns the decline may have legs.
(S&PGlobal) Assets under management at mutual funds and ETFs that invest in U.S. leveraged loans shed another $1 billion in April as retail investors continue their retreat from high-profile market segment.
It was the sixth straight monthly decline, bleeding some $33.3 billion from loan fund coffers since October. Loan fund AUM now stands at $150.9 billion, the least since March 2017, according to Lipper and LCD.
Treasuries break out against the March high

The 10-year Treasury Note Index rallied above the March 27 high at 125.04. It remains on a buy signal with a potential target at the Cycle Top resistance at 127.87. The Cycles Model suggests the rally may continue through mid-June.
(ZeroHedge) What was behind today’s furious buying and/or short-covering frenzy in US Treasurys, which sent the 10Y yield briefly below 2.30%, the lowest since 2017, inverted the 3M-10Y curve and pushed all bond yields left of the 30Y below the Fed Funds rate?
That was the question on every bond trader’s lips today, when as stocks were tumbling, capital seemed to flood into rates. One explanation, or attempt thereof, came from BMO’s Ian Lyngen, who writes that “there are certain days when the price action itself is the key development – Thursday fits this characterization.” In short, the price made the price, which makes sense since there was no notable, fundamental developments to justify the third biggest percentage drop in 10Y yields in the past 12 months.
The euro trend is still driven by weekly Short-term resistance

The euro declined to a marginal new low on Thursday, then rallied to test weekly Short-term resistance at 111.13. The Cycles Model suggests new lows may be in order in the next two weeks or more.
(Reuters) – Expected gains for populist eurosceptic parties in this week’s European Parliament elections could prompt a shift in the political balance of power in leading member states and stall moves towards deeper economic integration.
Voting across the 28-nation EU runs from Thursday till Sunday and eurosceptic parties are forecast to do well, including in the three biggest countries of the euro zone, Germany, France and Italy.
An exit poll in the Netherlands, which along with Britain voted on Thursday, showed mainstream pro-EU parties performing surprisingly well but analysts warned against reading too much into the Dutch results.
EuroStoxx consolidates above Intermediate-term support

Note: StockCharts.com is not displaying the Euro Stoxx 50 Index at this time.
The EuroStoxx 50 SPDR bounced from Intermediate-term support at 36.85, but could not rise above last week’s close. It is on a sell signal beneath Short-term resistance at 37.69. The Cycles Model suggests up to 7 weeks of decline may lie ahead.
(CNBC) European stocks closed higher on Friday, with investors returning to risk assets as fears over the U.S.–China trade battle receded.
The pan-European Stoxx 600 index closed provisionally almost 0.6% higher with the majority of sectors and all major borses in positive territory. Mining stocks, with their exposure to China and trade news, were among the biggest gainers, jumping over 1%.
That marked a contrast with Thursday’s session, in which European equities dropped sharply on the back of trade jitters.
The yen gets a second wind

The yen pulled back on Tuesday to test Intermediate-term support and mid-Cycle support at 90.28 but spent the rest of the week regaining lost ground. The Cycles Model suggests a rally in strength through the end of May or possibly early June before any consolidation.
(JapanTimes) President Donald Trump’s announcement May 5 that the United States will impose additional tariffs on Chinese goods has killed the optimism that had begun to emerge over the U.S.-China trade talks, causing them to take a turn for the worse. With the subsequent imposition of the additional tariffs, pessimism prevailed over the course of the world economy and stock markets worldwide, including in the U.S. and China, plummeted.
As of May 14, the Nikkei 225 average had declined 7.2 percent from its April high. The yen also went up from the 112-113 range to the dollar in April to 109-110. It was not the first time that stock market declines have caused the yen to rise. As indicated in the accompanying chart, since 2004 there has been a strong tendency that a stock market fall in Japan leads to a stronger yen, while a surge in share prices leads to the yen’s fall. Why is this?
Nikkei consolidates beneath mid-Cycle resistance
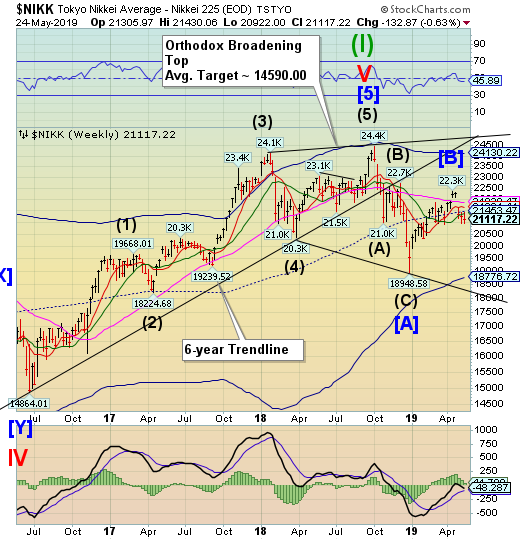
The Nikkei consolidated for a third week beneath mid-Cycle resistance at 21453.47. The island reversal stands and implies a strong sell signal. However, there is a support line at 20900.00 that may sustain a bounce, at least temporarily. Should it give way then all bets are off.
(JapanTimes) The benchmark Nikkei average lost further ground on the Tokyo Stock Exchange on Friday, with investor sentiment dampened by a continued fall in U.S. shares overnight amid growing concerns over the global economy and the U.S.-China trade war.
The key 225-issue Nikkei average dropped 33.92 points, or 0.16 percent, to end at 21,117.22, after tumbling 132.23 points on Thursday.
On the other hand, the Topix index of all first-section issues finished up 0.63 point, or 0.04 percent, at 1,541.21, rising for the first time in four days. It fell 5.63 points on Thursday.
U.S. dollar abruptly reverses
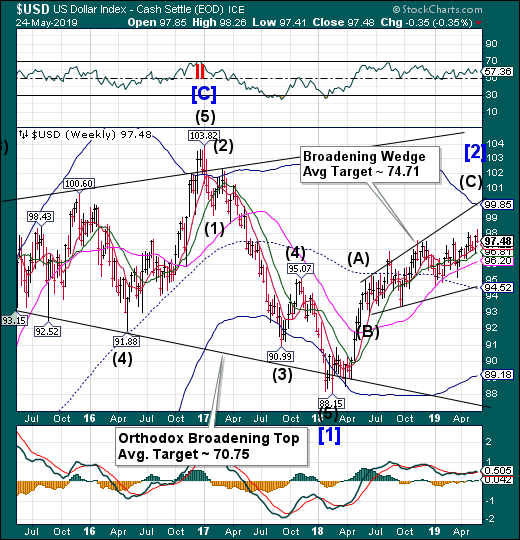
DX had been on the rise through Thursday when it made the 98-handle for the first time in over 2 years. On Friday it gapped down, erasing all the gains made this week. It appears that dollar weakness may surprise investors over the next two or more weeks.
(DailyFX) It was a climactic day across global markets on Thursday, extending what’s become a very active week. European Parliamentary elections are currently taking place, and this morning brought the announcement that British PM Theresa May will be stepping down on June the 7th. Outside of these very key drivers, a number of price action themes availed themselves, driven in-part by the release of FOMC minutes on Wednesday.
As looked at yesterday, the US Dollar rallied up to the two-year-high after the release of FOMC meeting minutes. And prices in USD did pose a topside push to establish a fresh two-year-high. But, that’s where the music stopped, and following the release of some poor PMI’s from yesterday, prices quickly reversed and pushed right back to a key area of support. This comes-in around 97.70, which was the prior yearly high, helping to set resistance in the longer-term ascending wedge pattern that punctuated the backdrop coming into Q2.
Gold rallies back above mid-Cycle support
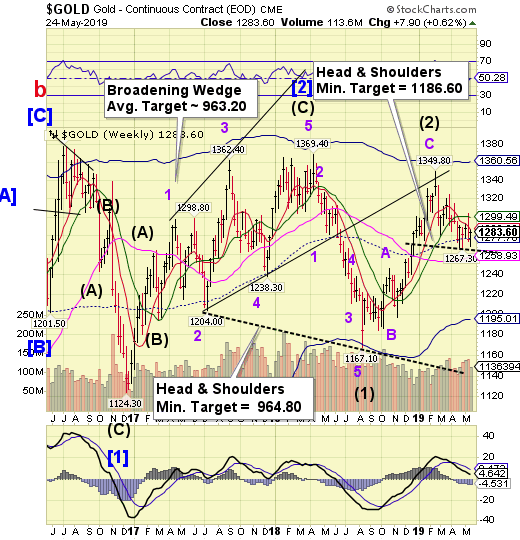
Gold had been on the decline until Thursday when it reversed above the Head & Shoulders neckline at 1267.36. It closed beneath Short-term resistance at 1286.90, leaving its future status uncertain. The neckline of the Head & Shoulders formation reinforces the sell signal when broken.
(KitcoNews) – Gold prices have been trading range-bound and whether or not prices break out depend mainly on how long the trade war with China lasts, this according to Phil Streible, senior market strategist of RJO Futures.
“I think that if we resolve [the trade agreement] at the next meeting, we could see interest rates start to actually poke back up again, the U.S. economy could get heated up again, and we might have this hawkish tone, but if we have it dragged out over a period of well over another year, we could see that really wane on the economy and that’s where your interest rate cuts come in,” Streible told Kitco News.
Crude falls beneath combination support

Crude declined fell through all supports, but closed at mid-Cycle support/resistance at 58.63. Crude is on a sell signal. The ensuing decline may last another 3-4 weeks. This may be the big one.
(OilPrice) Oil prices rose early on Friday, recovering from Thursday’s plunge that sent both WTI and Brent to their lowest levels in nearly two months, but prices are still poised to record the largest weekly decline of 2019 as rising U.S. crude inventories and fears of an economic slowdown have overshadowed signs of tightening global supply in recent days.
As of 08:52 a.m. EDT on Friday, WTI Crude was up 1.23 percent at $58.62, while Brent Crude was trading up 1.37 percent at $67.41.
Prices recouped on Friday some of the hefty losses from the previous day, when both benchmarks plunged in their worst one-day drop in six months. The oil and stock markets were hard hit on Thursday by the increased tension in the U.S.-China trade war, which has investors increasingly worried about the state of the global economy and, by extension, the outlook for global oil demand growth for the rest of the year.
Agriculture Prices bounce from a 3-year low

Last week the Bloomberg Agricultural Subindex hit a 34.4-month low from its peak in mid-June 2016. The Elliott Wave structure was an Ending Diagonal pattern of a Cycle Degree. It was also the final Wave of an impulsive Super Cycle decline beginning in April 2011. The initial probe from the bottom broke through the Weekly Short-term resistance as well as the Cycle Bottom resistance and is now on a buy signal. A preliminary estimate puts the initial rally up to the mid-Cycle resistance at 46.26.
(ZeroHedge) The Economic Innovation Group’s (EIG) Distressed Communities Index (DCI) shows a significant economic transformation (from two distinct periods: 2007-2011 and 2012-2016) that occurred since the financial crisis. The shift of human capital, job creation, and business formation to metropolitan areas reveals that rural America is teetering on the edge of collapse.
Since the crisis, the number of people living in prosperous zip codes expanded by 10.2 million, to a total of 86.5 million, an increase that was much greater than any other social class. Meanwhile, the number of Americans living in distressed zip codes decreased to 3.4 million, to a total of 50 million, the smallest shift of any other social class. This indicates that the geography of economic pain is in rural America.
Shanghai Index clings to support

The Shanghai Index clings to tenuous support at 2838.00 in another week of losses. The consolidation continues until the support gives way. The Cycles Model suggests the decline may last through the end of June.
(ZeroHedge) It’s only 9 am in New York but Friday’s session has already featured a frantic flurry of trade-war-related headlines that have – at least in the market’s view – overshadowed Theresa May’s tearful announcement that she will be stepping down as PM.
Beijing repudiated President Trump’s Thursday claim about a ‘speedy’ trade deal, saying there were no plans for a Trump-Xi meeting. US stock futures pared gains on that headline. Also, US firms ratcheted up the pressure on Huawei, with Microsoft (NASDAQ:MSFT) joining the contingent of chip and tech companies that is planning to cut ties with Huawei over Washington’s blacklisting.
And now, the South China Morning Post is reporting that China’s largest chipmaker is withdrawing its ADRs from the New York Stock Exchange, and will subsequently trade only in Hong Kong. The company said ‘low trading volumes’ and the ‘cost of maintaining the listing’ motivated its decision.
The Banking Index breaks the Diamond
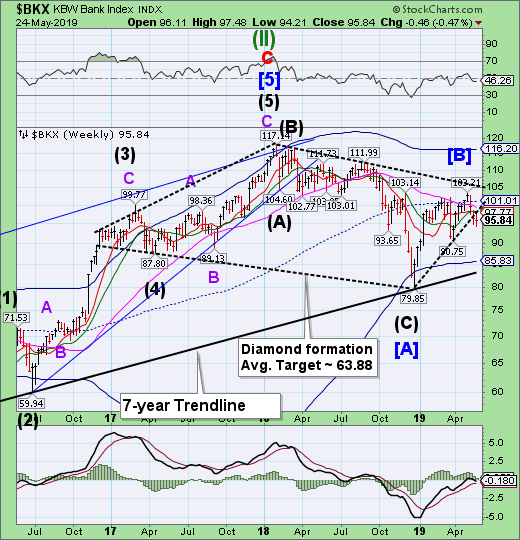
— BKX tested the Diamond Trendline on Monday, then made a new low on Thursday before bouncing back near breakeven for the week. The Diamond formation has been broken and may lead to a substantial decline over the next six weeks.
(ZeroHedge) There was a time when in the years following the financial crisis, every Friday the FDIC would report of one or more small and not small banks failing, as their liabilities exceeded their assets, who were taken over by larger peers with a taxpayer subsidy to cover the capital shortfall. And while this weekly event, also known as “FDIC Failure Friday” has faded from the US, for now, it has made a grand appearance in China.
China’s financial regulators said on Friday the country’s banking and insurance regulator and the central bank, will take control of the small, troubled inner Mongolia-based Baoshang Bank due to the serious credit risks it poses. The regulator’s control of Baoshang will last for a year starting on Friday, the People’s Bank of China (PBOC) and China Banking and Insurance Regulatory Commission (CBIRC) said on their websites.
(ZeroHedge) It was the peak of poetic justice that on the day Deutsche Bank (DE:DBKGn) held its annual general meeting, during which the top leadership of the imploding German lender felt the ire of its shareholders who withheld their backing for executives and several urged the chairman to step down early during the tense Frankfurt meeting, that DBK stock hit a fresh all time low of €6.35 per share, its market cap sliding to $15.8 billion, just barely above the market cap of Darden Restaurants (NYSE:DRI).
It was also the day when the bank’s 7.5% Contingent Convertible notes suffered their biggest 2-day drop since the September 2016 collapse which brought Deutsche Bank to the verge of nationalization.
Naturally, none of this helped ease the fury of investors, who have lost tremendous capital by keeping their faith in a turnaround that never comes. While the bank’s largest shareholders – Qatar and Cerberus – kept a low profile, those who spoke during the investor day, expressed anger and disbelief that what was once among Europe’s dominant banks has a market value that would make it the fifth-biggest in France according to Bloomberg. One noted that the price for a share had fallen below the cost of a pack of cigarettes.
(Bloomberg) The Bank of England is warning that the safety of the financial system could be at risk from big investment banks extending loans against borrowers’ share holdings.
Banks in London lost more than 1 billion euros ($1.1 billion) on a single so-called margin loan deal in 2017, Sam Woods, chief executive of the BOE’s Prudential (LON:PRU) Regulation Authority, said in a speech in London.
The loans are “not well captured by today’s capital framework for banks,” Woods said. “Complexity creates a weakness in the system.”