
AT40 = 23.0% of stocks are trading above their respective 40-day moving averages (DMAs) (low of 18.9%)
AT200 = 22.6% of stocks are trading above their respective 200DMAs (new 32-month low)
VIX = 22.6 (as high as 25.9)
Short-term Trading Call: cautiously bullish
Commentary
It was a wild day in the stock market, but the market still avoided closing in oversold territory. AT40 (T2108), the percentage of stocks trading above their respective 40DMAs, dropped to 23.0%, a fraction below its lowest close at the end of November’s sell-off. At one point, AT40 WAS oversold with an 18.9% reading (oversold is below 20%). AT200 (T2107), the percentage of stocks trading above their respective 200DMAs, dropped to a new 32-month low at 22.6%. Still, the S&P 500 (SPY (NYSE:SPY)) managed to close with a fractional gain of 0.2%. The index traded as low as 1.9% below the previous close as sellers took early control of the stock market.
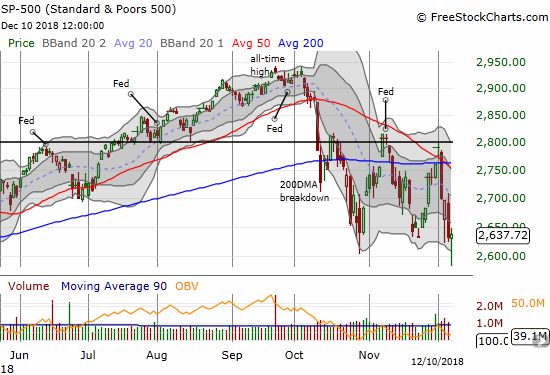
The S&P 500 (SPY) rebounded sharply and clawed its way back to the recent lows. The intraday low retested the double-bottom closing lows from February and April.
The bad news is that the divergence between AT40 and the S&P 500 is bearish. I was looking for a bullish divergence with the exact opposite relationship; bullish divergences market the end of the last two selling periods. AT200’s new 32-month low is a brighter red flag indicating that the selling is far from over in the short-term. If buyers follow-through on the S&P 500 and carry AT40 and AT200 along for the ride, I will get incrementally more confident in the short-term outlook.
The NASDAQ and the Invesco QQQ Trust Series 1 (NASDAQ:QQQ) out-performed the S&P 500. Both tech laden indices are still off their November lows, although the NASDAQ came close to a retest. With the bearish divergence, I am still expecting a true test of the November lows if not an outright breakdown.
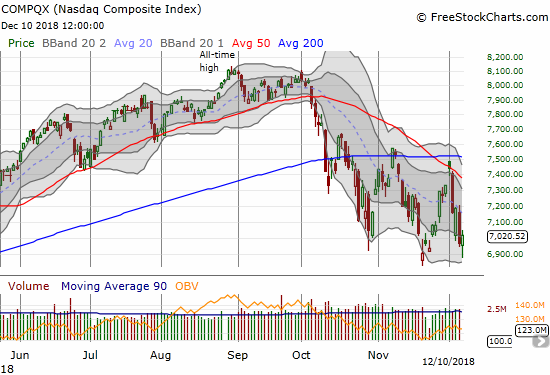
The NASDAQ gained 0.7% on the day after its intraday low slipped past the closing low of this selling cycle.
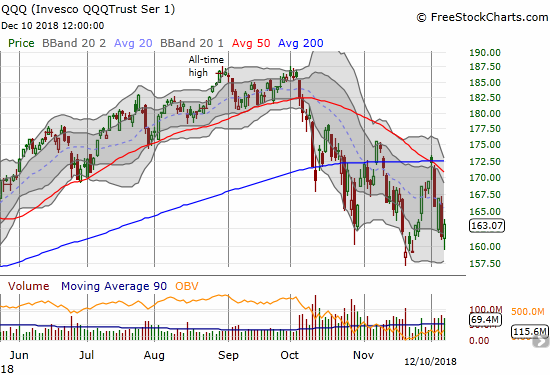
The Invesco QQQ Trust (QQQ) gained a healthy 1.1% after rebounding from its low.
Despite the bearish divergence, the volatility index, the CBOE Volatility Index, still dropped. The VIX got as high as the 26 level which capped the last bounce. I can only hope that this is a sign of seller’s exhaustion finally setting in. I do not want to get ahead of AT40 here, so I am not upgrading my short-term trading call from cautiously bullish to bullish.
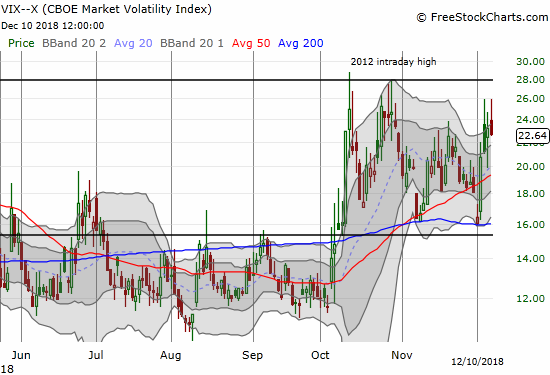
The volatility index, the VIX, stopped rising right at the intraday high of this cycle. It ended the day at a small loss.
Financials are still in the leaky boat that reminds me of that sinking feeling. The Financial Select Sector SPDR ETF (NYSE:XLF) lost 1.4% with a new 15-month closing low. The only good news: XLF managed to bounce sharply off its lows like the rest of the market. The odds were on the side of a bounce with XLF trading so far below its lower Bollinger Band® (BB). If buyers can maintain momentum with a close above the day’s intraday high, XLF can confirm a bottoming hammer pattern.
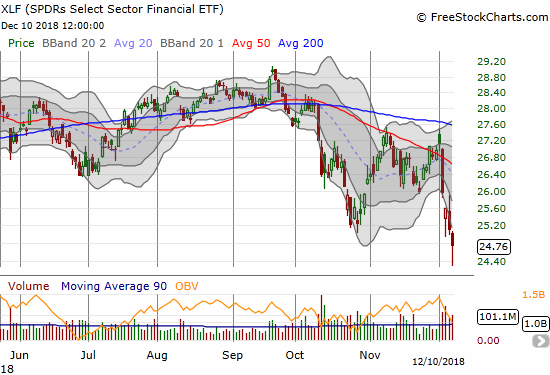
The Financial Select Sector SPDR (NYSE:XLF) lost 1.4% to close at a new 15-month low.
The iShares US Home Construction (NYSE:ITB) joined the leaky boat with a surprisingly sharp 2.0% loss. ITB barely even moved off its intraday low. Interest rates even fell further on the day. Home builders and financials were key sectors contributing to the bearish divergence on the day.
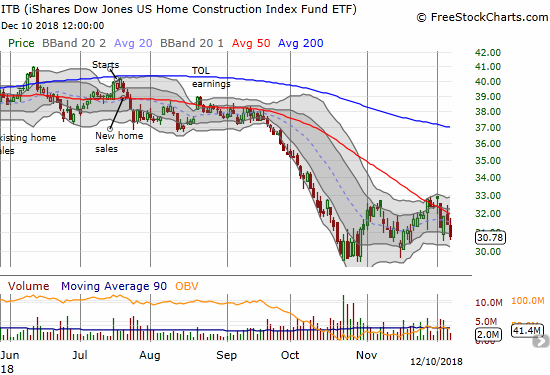
The iShares US Home Construction ETF (ITB) lost a whopping 2.0% and (re)confirmed its downward trending 50DMA resistance.
CHART REVIEWS
Apple (NASDAQ:AAPL)
The drama continues with AAPL. The stock hit a new 8-month low after gapping down on headlines of a Qualcomm (NASDAQ:QCOM) victory in China over the sale of old iPhones. Buyers went right to work (share buyback anyone?) off the lows. Some credited this action with helping to lift a lot of the market of its lows. I think the buying is encouraging, but it is more likely just coincident with the general rush to buy short-term bargains in the stock market.
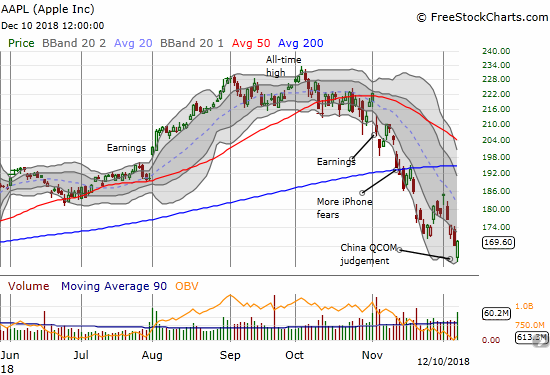
Apple (AAPL) staged a sharply rally from a 3.1% loss and near 8-month low to a 0.7% gain.
Home Depot (NYSE:HD)
Market observers and pundits have frequently pointed to HD as a retail stock uniquely immune to the bearish change in fortunes of the home builders. HD’s fortunes are slowly changing with the October breakdown and persistent weakness that mirrors the general stock market. HD failed to close with a gain after buyers rushed into the breach created by sellers.
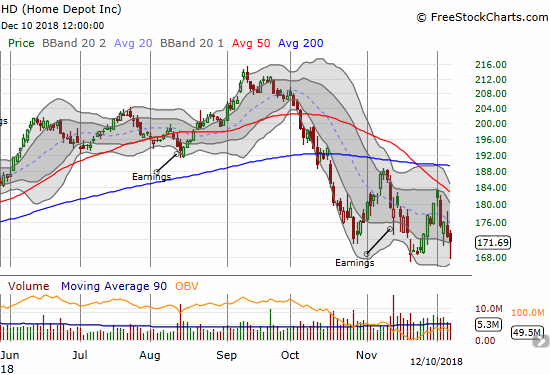
Home Depot (HD) still lost 0.6% after buyers picked the stock off recent lows.
“Above the 40” uses the percentage of stocks trading above their respective 40-day moving averages (DMAs) to assess the technical health of the stock market and to identify extremes in market sentiment that are likely to reverse. Abbreviated as AT40, Above the 40 is an alternative label for “T2108” which was created by Worden. Learn more about T2108 on my T2108 Resource Page. AT200, or T2107, measures the percentage of stocks trading above their respective 200DMAs.
Active AT40 (T2108) periods: Day #26 over 20% (overperiod), Day #2 under 30% (underperiod), Day #4 under 40%, Day #54 under 50%, Day #70 under 60%, Day #123 under 70%
Daily AT40 (T2108)
")
Black line: AT40 (T2108) (% measured on the right)
Red line: Overbought threshold (70%); Blue line: Oversold threshold (20%)
Weekly AT40 (T2108)

Be careful out there!
Full disclosure: long AAPL calls, calendar call spread, put spread; long ITB calls, long QQQ calls, long UVXY puts