Stocks moved higher on Friday, despite the Jobs report coming in much lighter than expected. The move higher allowed the S&P 500 at least to break free of its recent trading range, while the other indexes continued to show signs of weakness.
The options market was only implying a move of 1.15% last week, based on the long straddle strategy from the $422.50 strike price.
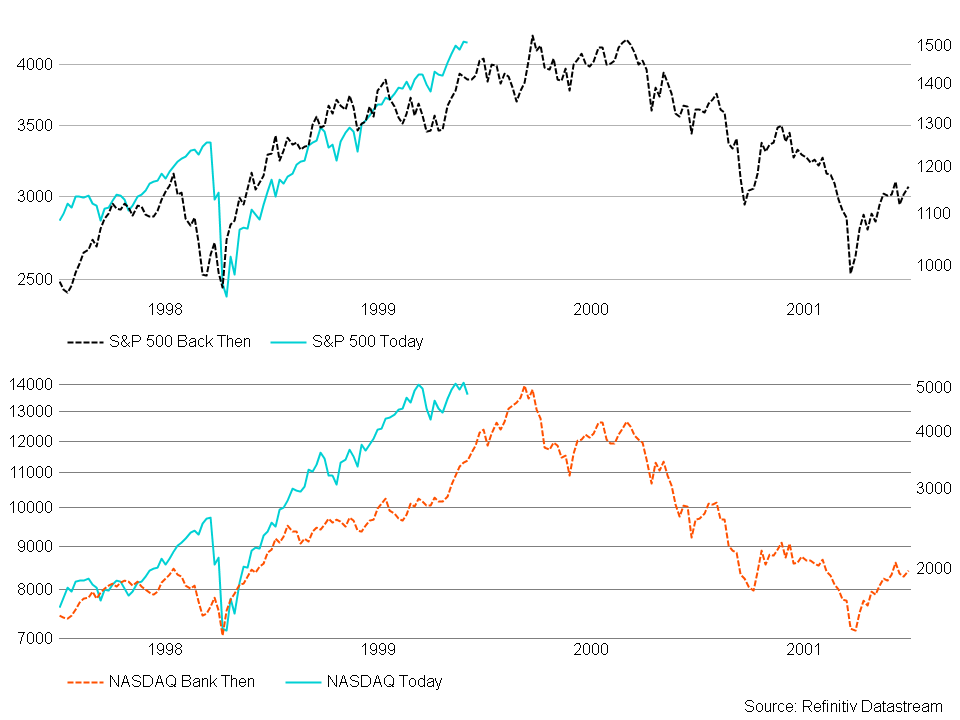
The Ghost Of 1999
The divergence of the indexes is very reminiscent of that of the late 1990s. The 1998 bottom serves as the perfect starting point for the S&P 500 of today. Again, perhaps it is a coincidence, and I’m not trying to suggest they are the same or that the same fate lies ahead. I’m merely trying to point the similarities.
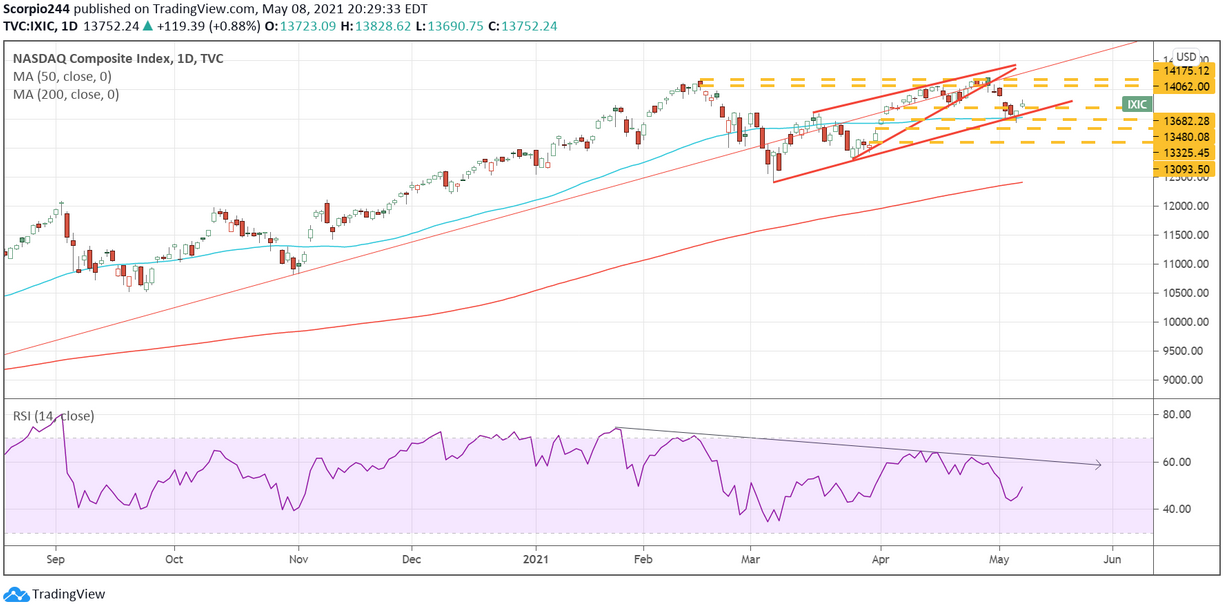
1. NASDAQ Comp
The Nasdaq Composite has been able to find support around the 50-day moving average. Clearly, a break of that moving average would be a big blow and likely result in the Composite moving back to the March 2021 lows. The index has lost plenty of momentum, so this week could be of great importance in determining what happens next.
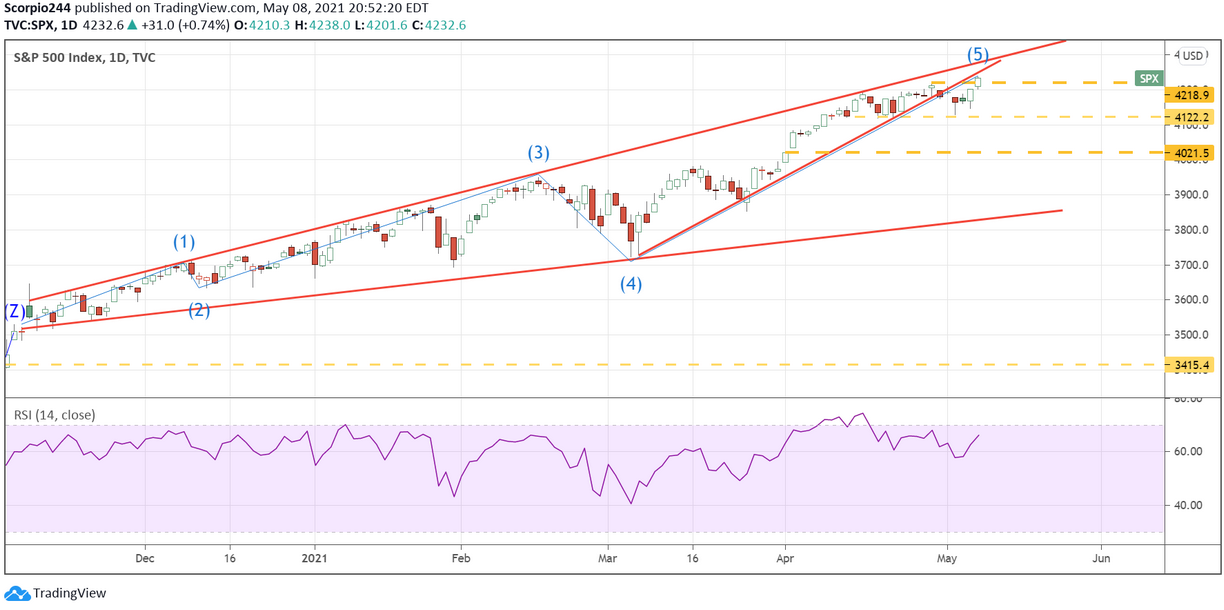
2. S&P 500 (SPY)
One could argue there were plenty of points where we could have seen the end of this recent rally in the S&P 500, and through the miracles of market rotation, the index has managed to grind sideways or higher in astonishing fashion.
However, one could also point to this recent high as the end of a 5 wave count off Vaccine Monday. That was when a broadening wedge pattern started. Additionally, Wave 3 is equal to 1.618% of Wave 1, and Wave 5 is equal to 1.618% of Wave 3. It does nicely. Wave 5 would complete somewhere around this 4250 region.
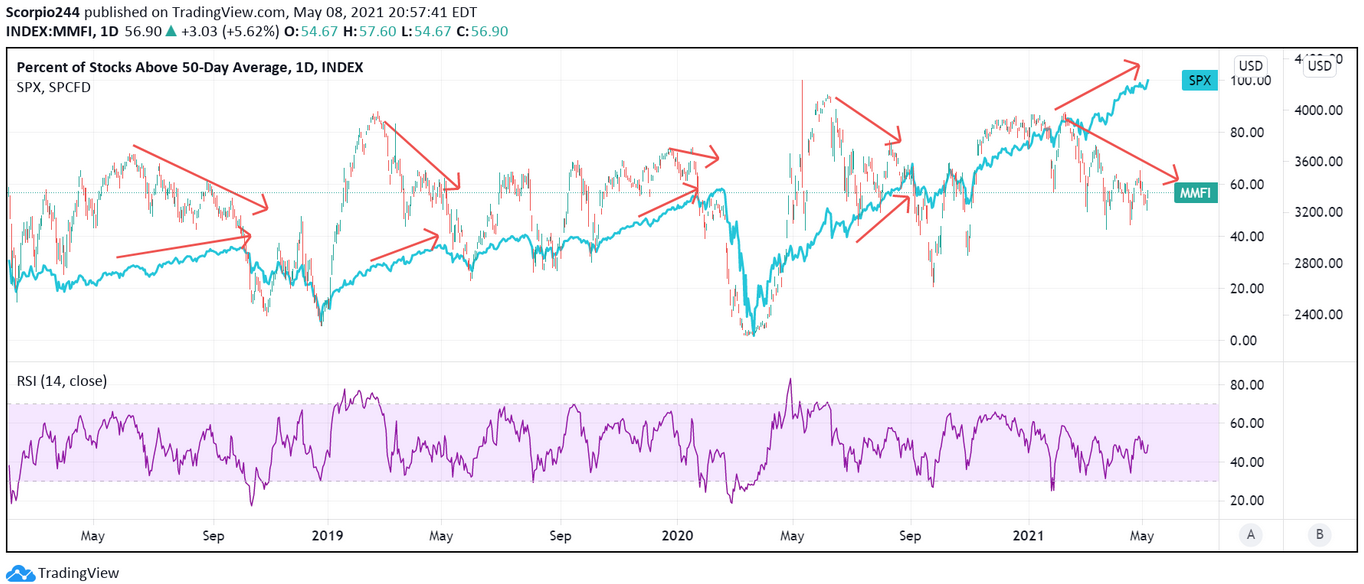
There also remains a substantial divergence in terms of the trend in the S&P 500 and the percentage of total stocks above their 50-day moving average. Of course, none of this tells when a correction will occur in the market.
It tells us that we must remain on a high alert because not all is healthy in the market.
3. Alibaba
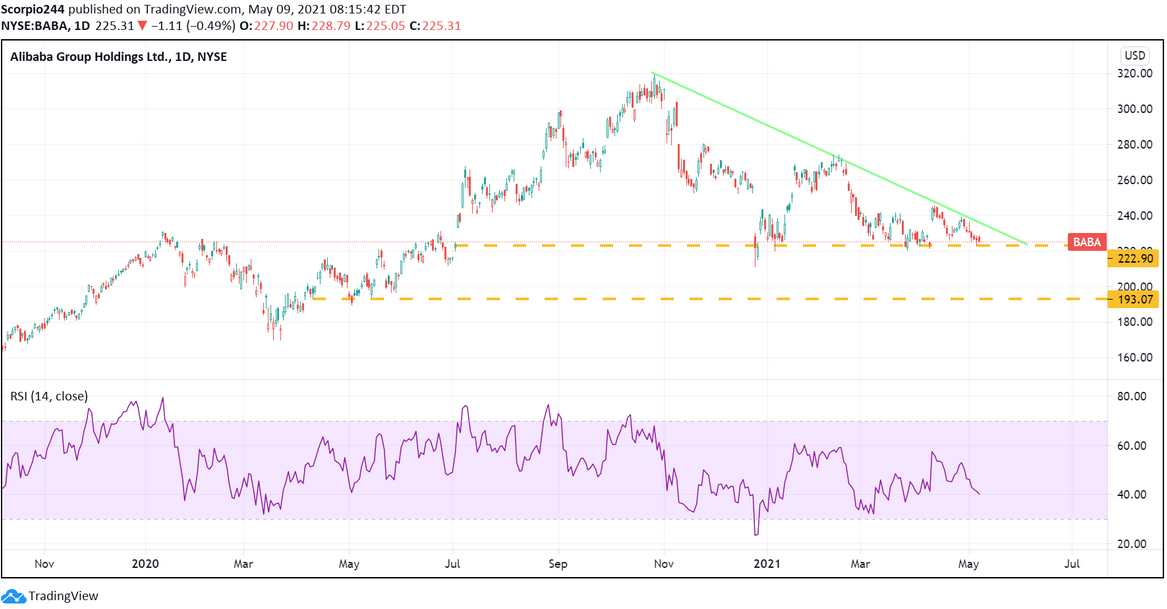
Alibaba Group Holdings (NYSE:BABA) will report results later this week, and the chart does not look strong. The stock has been struggling for months, and there appears to be a descending triangle pattern. That is a bearish pattern suggesting the stock falls to around $193.
4. Capital One
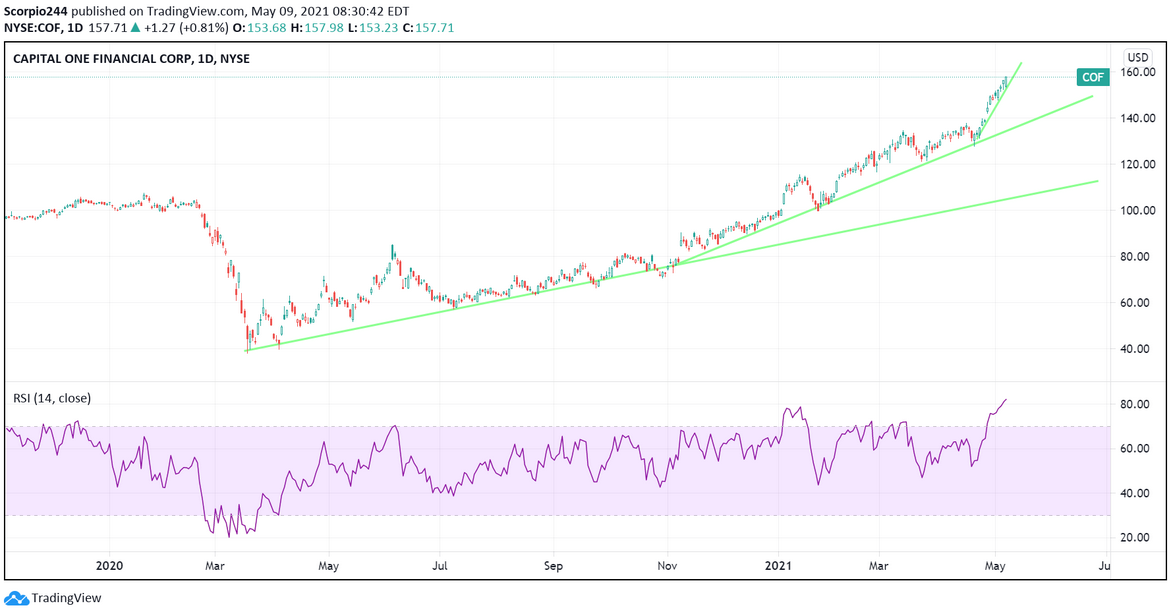
Capital One Financial Corporation (NYSE:COF) has been on a parabolic run higher recently, with multiple bump-and-run patterns. Perhaps it can continue over the longer term, but with an RSI of 82, one has to think it pauses and consolidates sideways or moves lower.
5. 3M
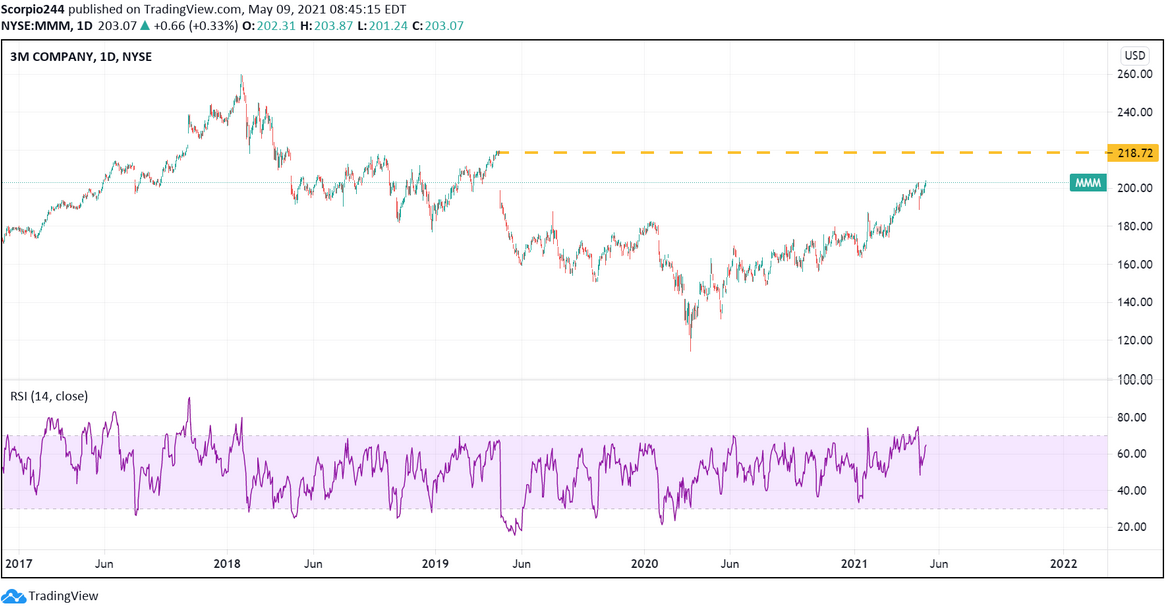
3M Company (NYSE:MMM) has made it this far; you have to think it will fill the rest of the gap up to $219.
6. Uber
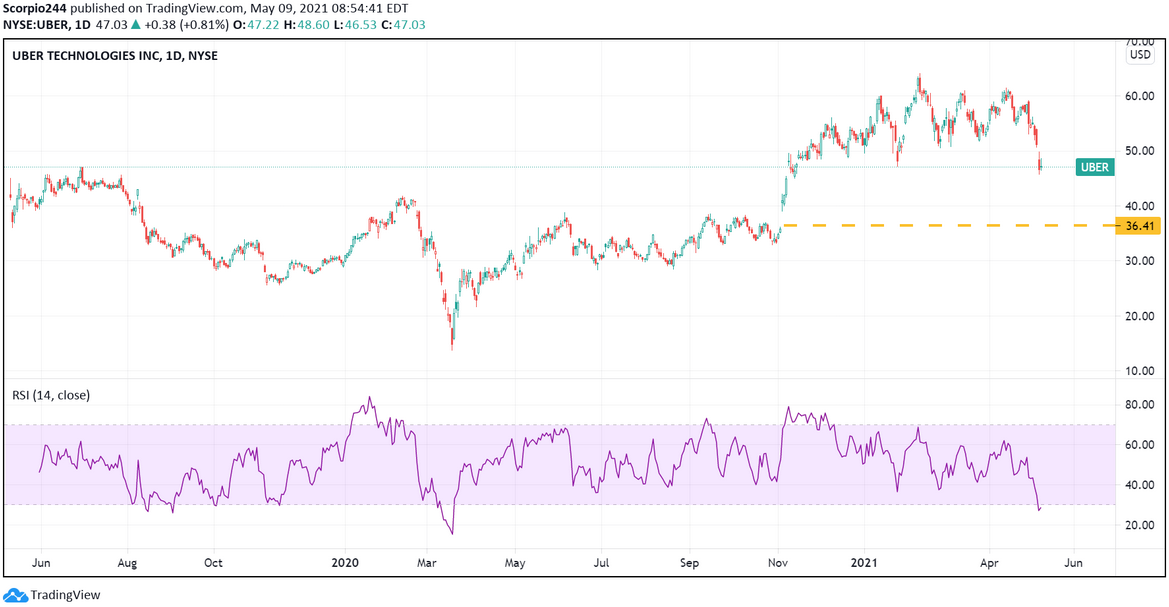
Uber Technologies (NYSE:UBER) looks terrible, and the stock has performed the last several weeks horribly, and there seems to be no reason to me why it can’t retest $36.
7. Zoom Video
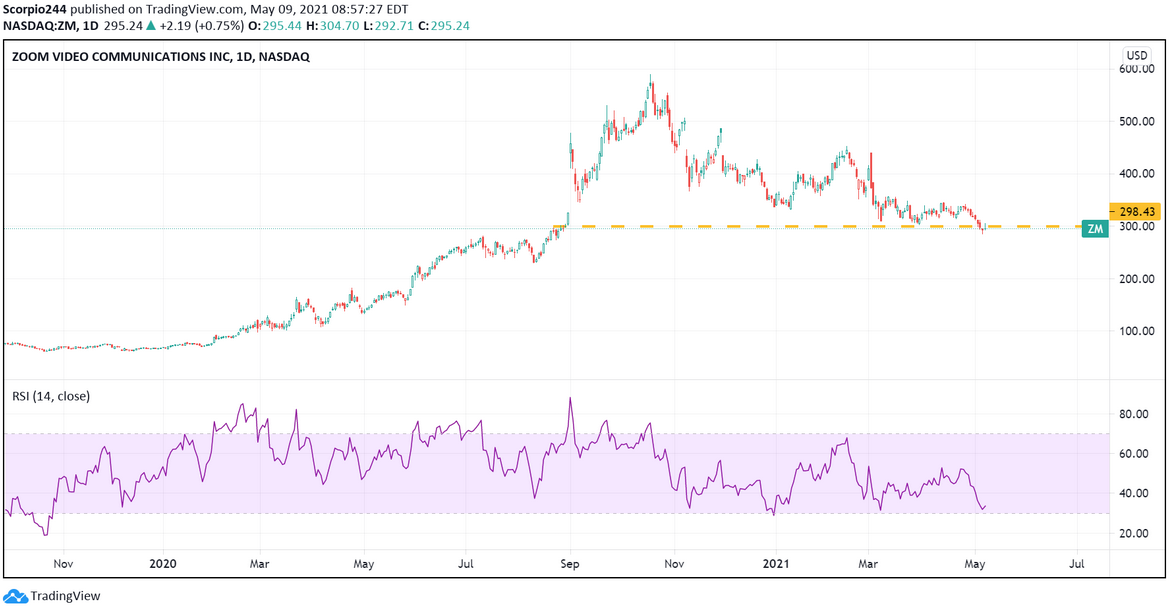
I guess we can only wonder at this point if the deflation of Zoom Video Communications Inc (NASDAQ:ZM) will continue to not.
Clearly, we know just how overvalued the stock was. No doubt they have changed how we communicate, and the stock will likely be a good buy at some point, but probably not yet.
Would it be surprising to see it back at $200, before not too long? No, I would not be surprised at all.
8. DocuSign
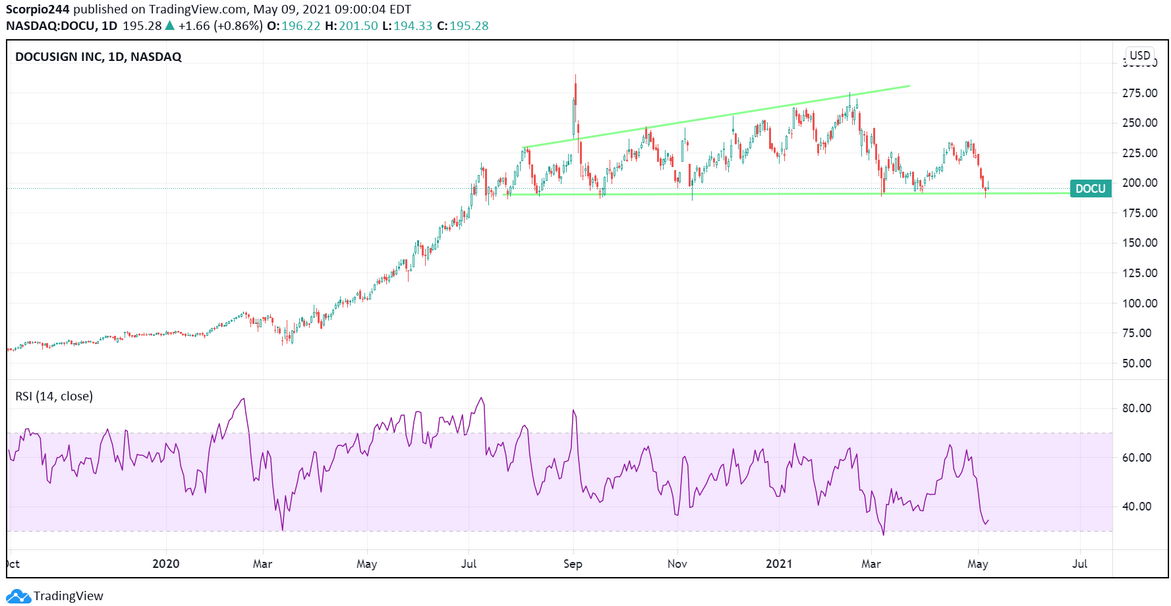
DocuSign Inc (NASDAQ:DOCU) is another stock deflating. I’m not sure what is they do that is special.
You can sign a Document electronically, great. Sounds revolutionary? Not really.
It has been holding on to $190 for its dear life, but, once it breaks, it is over; with a long deflationary way down.
9. Roku
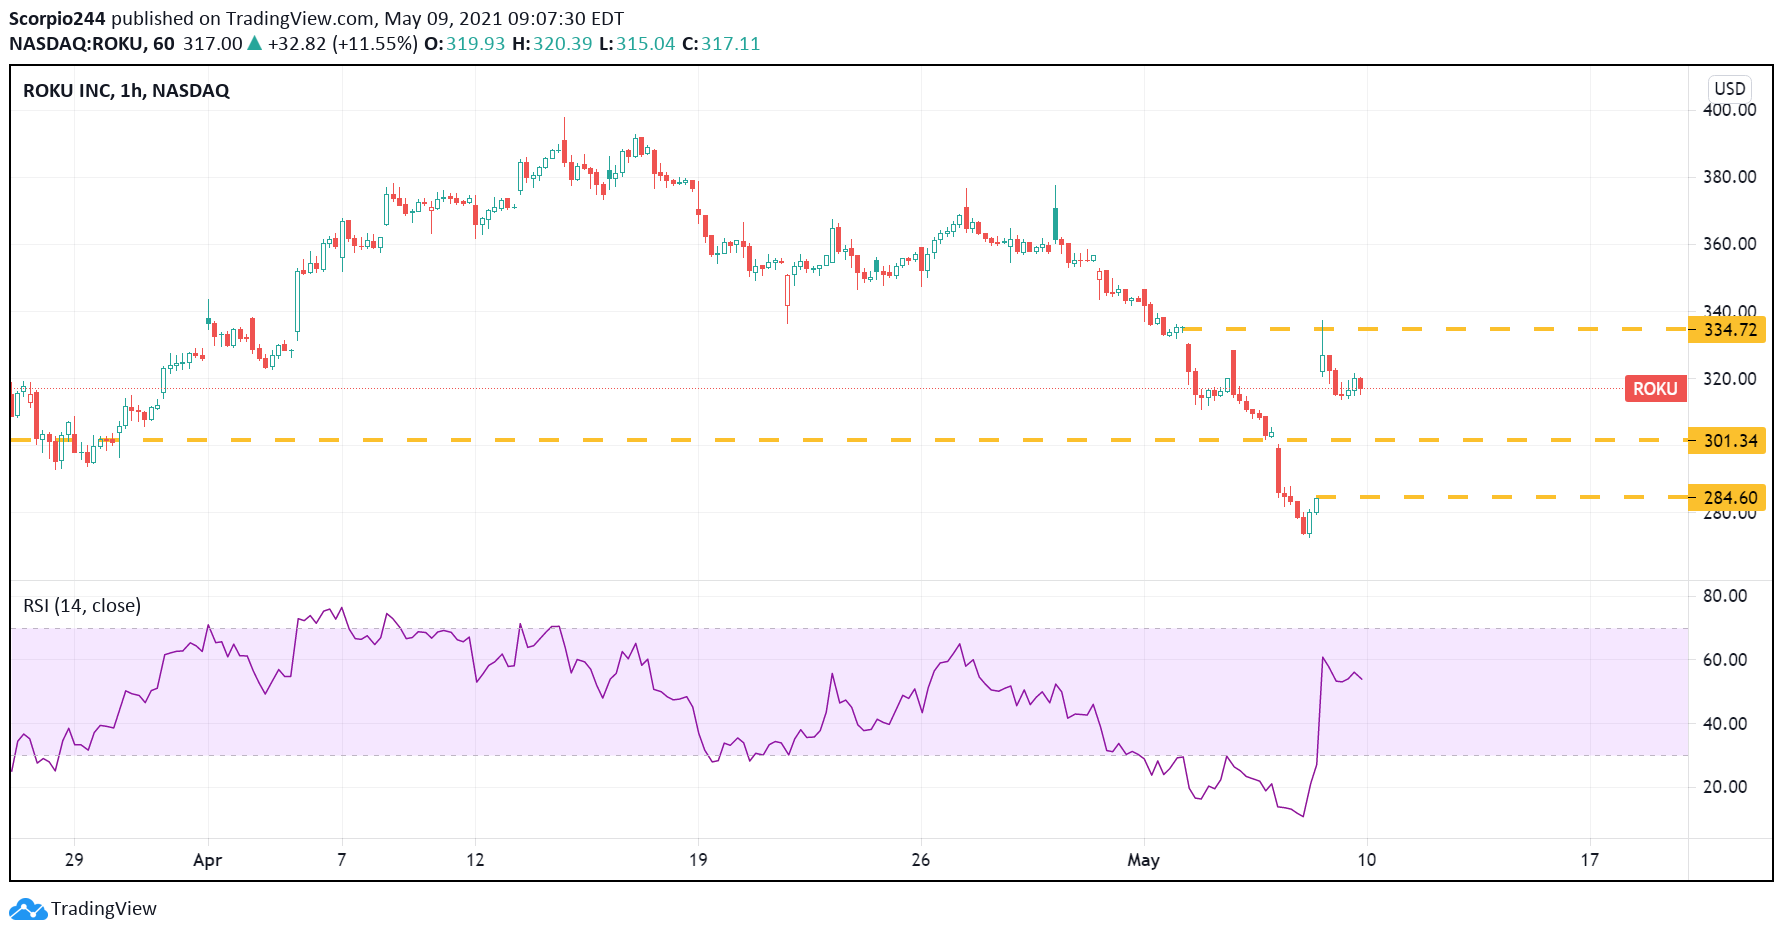
Well, Roku's (NASDAQ:ROKU) active account growth seems to be slowing dramatically on a quarter-to-quarter basis.
They still have roughly the same number of accounts as Amazon (NASDAQ:AMZN), so there is nothing disruptive.
You would be surprised at the number of people that do not know that Fire Stick and Roku have about the same number of active accounts. It looks like it filled the gap at $335, and now it will probably fill the gap at $285.
