By Caroline Valetkevitch
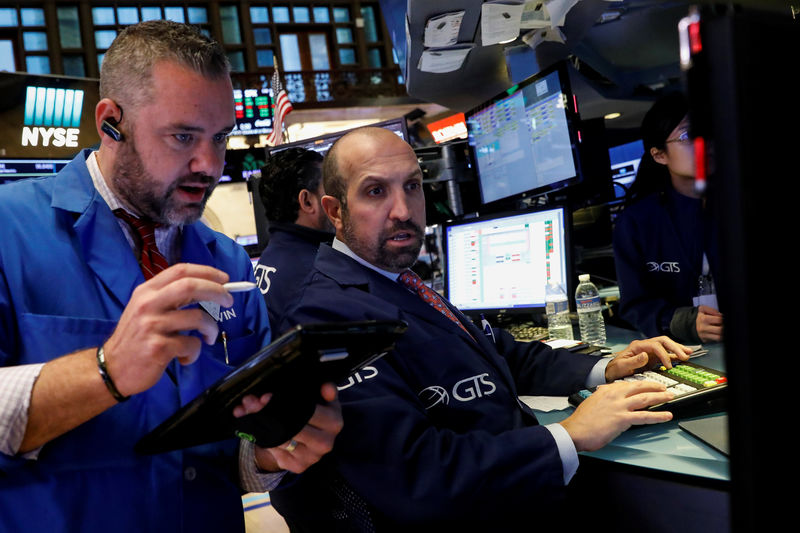
NEW YORK (Reuters) - The S&P 500 eased on Friday, ending a six-day run of record highs as the first monthly decline in U.S. nonfarm jobs in seven years dampened sentiment and pharmacy shares fell on Amazon competition fears.
The Nasdaq ended up for a ninth straight day, however, and set its sixth straight record high close, its longest such streak since seven records in February.
Walgreens Boots Alliance (O:WBA) and CVS Health (N:CVS) fell and were among the biggest drags on the S&P 500 after a CNBC report that Amazon (O:AMZN) was close to a decision on selling prescription drugs. Walgreens shares dropped 4.9 percent and CVS was down 4.9 percent, while Amazon shares rose 0.9 percent.
The Labor Department's closely watched jobs report showed nonfarm payrolls fell by 33,000 in September as hurricanes Harvey and Irma left displaced workers temporarily unemployed and delayed hiring. A bright spot was a better-than-expected rise in average wages.
"It's been amazing how resilient our U.S. stock market has been, going up on no news or bad news, so there's no surprise on a day where most people feel it was a mixed jobs report at best that the market actually is reacting in a way that makes sense," said Jake Dollarhide, chief executive officer of Longbow Asset Management in Tulsa, Oklahoma.
"It's a logical move for this illogical stock market."
The Dow Jones Industrial Average (DJI) fell 1.72 points, or 0.01 percent, to end at 22,773.67, the S&P 500 (SPX) lost 2.74 points, or 0.11 percent, to 2,549.33 and the Nasdaq Composite (IXIC) added 4.82 points, or 0.07 percent, to 6,590.18.
The benchmark's slight decline follow a six-day run of record closing highs, its longest since 1997.
The CBOE Volatility index (VIX), Wall Street's fear gauge, bounced sharply after setting a record low close in the previous session.
For the week, the S&P 500 rose 1.2 percent, the Dow added 1.6 percent and the Nasdaq gained 1.5 percent.
Adding to the day's worries was a report that North Korea is preparing to test a long-range missile.
S&P energy index (SPNY) declined 0.8 percent as oil prices (CLc1) (LCOc1) fell amid a bout of profit taking and the return of oversupply worries.
Shares of Costco (O:COST) dropped 6 percent after the warehouse club retailer reported a fall in gross margins. The stock was the biggest drag on the S&P 500 and the Nasdaq.
Declining issues outnumbered advancing ones on the NYSE by a 1.74-to-1 ratio; on Nasdaq, a 1.11-to-1 ratio favored decliners.

About 5.7 billion shares changed hands on U.S. exchanges. That compares with the 6.2 billion daily average for the past 20 trading days, according to Thomson Reuters data.