Breaking News
Investing Pro 0
Free Webinar - Unlock Divergence Trading: Learn from Seth Julian MBA | TThursday, March 23, 2023 | 10:00AM PST Enroll Now

U.S.-China trade row sends U.S. bond yields tumbling

Economic Indicators Aug 05, 2019 07:06PM ET
Saved. See Saved Items.
This article has already been saved in your Saved Items
 
 
BARC
-0.94%
Add to/Remove from Watchlist
Add to Watchlist
Add Position

Position added successfully to:

Please name your holdings portfolio
 
TYM3
+0.08%
Add to/Remove from Watchlist
Add to Watchlist
Add Position

Position added successfully to:

Please name your holdings portfolio
 
USM3
+0.19%
Add to/Remove from Watchlist
Add to Watchlist
Add Position

Position added successfully to:

Please name your holdings portfolio
 
US3MT=X
+1.08%
Add to/Remove from Watchlist
Add to Watchlist
Add Position

Position added successfully to:

Please name your holdings portfolio
 
US6MT=X
+1.01%
Add to/Remove from Watchlist
Add to Watchlist
Add Position

Position added successfully to:

Please name your holdings portfolio
 
US2YT=X
-0.61%
Add to/Remove from Watchlist
Add to Watchlist
Add Position

Position added successfully to:

Please name your holdings portfolio
 

By Richard Leong

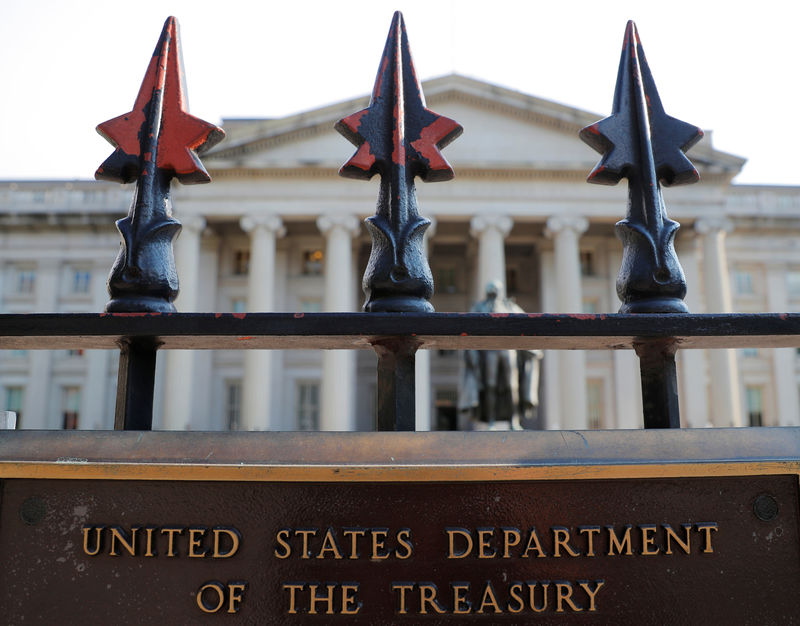
NEW YORK (Reuters) - U.S. Treasury yields tumbled on Monday, with 10-year yields hitting the lowest since November 2016, as fears over escalating U.S.-China trade tensions renewed concerns about an economic downturn and spurred a fourth straight session of gains in bonds.

China allowed the yuan to breach the key seven-per-dollar level for the first time in more than a decade, a sign Beijing might be willing to tolerate more currency weakness that could further inflame the bilateral trade conflict.

Chinese state media said local firms have halted U.S. agricultural purchases, elevating anxiety about tit-for-tat moves by the world's two biggest economies. The Chinese measures followed U.S. President Donald Trump's threat last week to impose 10% tariffs on $300 billion of Chinese imports starting Sept. 1.

"There's a lot of fears out there," said Larry Milstein, head of government and agency trading at R.W. Pressprich & Co in New York. "What is the path that could end this? It doesn't seem we are going to get there anytime soon."

The growing trade friction seemed to have begun hurting the U.S. services sector on top of squeezing domestic manufacturers.

The Institute for Supply Management's index on U.S. services activity showed the vast economic sector's growth slowed to its weakest level in three years in July.

Anxious investors have been bailing from stocks and other risky assets with Wall Street's main stock indexes falling 2%.

They have favored U.S. government debt, the Japanese yen, gold and other perceived low-risk assets to park their money.

The Treasuries market recorded a total return of 1.31% last week, which was its biggest weekly gain since November 2011, according to an index compiled by Bloomberg and Barclays (LON:BARC).

In late U.S. trading, the yield on benchmark 10-year Treasury notes (US10YT=RR) was down 12.7 basis points at 1.7278%. It hit 1.728% earlier on Monday, the lowest since Nov. 9, 2016, the day after Trump was elected president.

The two-year yield (US2YT=RR), which is sensitive to traders' view on Fed policy, touched 1.571%, its lowest since November 2017. It was last 14.7 basis points lower at 1.5753%.

Interest rates futures implied traders fully expect the U.S. Federal Reserve to lower rates again at its Sept. 17-18 policy meeting after cutting them last week for the first time since 2008, CME Group's FedWatch program showed.

The difference between the three-month Treasury bill rate (US3MT=RR) and 10-year yields (US10YT=RR) grew to nearly 27 basis points, the widest since April 2007.

This curve "inversion" between the two maturities has preceded every U.S. recession in the past 50 years.

The blistering demand for Treasuries is expected to stoke bids for this week's quarterly refunding where the government will sell $38 billion in three-year debt, $27 billion in 10-year notes and $19 billion in 30-year bonds.

"I wouldn't expect to have a major impact on refunding," said Jon Hill, an interest rates strategist at BMO Capital Markets.

August 5 Monday 2:25PM New York / 1825 GMT

Price

US T BONDS SEP9 (USc1) 160-22/32 67/32

10YR TNotes SEP9 (TYc1) 129-220/256 32/32

Price Current Net

Yield % Change

(bps)

Three-month bills (US3MT=RR) 1.9675 2.0097 -0.054

Six-month bills (US6MT=RR) 1.9425 1.9885 -0.027

Two-year note (US2YT=RR) 100-84/256 1.5813 -0.141

Three-year note (US3YT=RR) 100-154/256 1.5398 -0.139

Five-year note (US5YT=RR) 101-10/256 1.5326 -0.137

Seven-year note (US7YT=RR) 101-166/256 1.6243 -0.127

10-year note (US10YT=RR) 105-184/256 1.7362 -0.119

30-year bond (US30YT=RR) 112-128/256 2.2933 -0.099

YIELD CURVE Last (bps) Net

Change

(bps)

10-year vs 2-year yield 15.40 2.35

30-year vs 5-year yield 76.00 3.75

DOLLAR SWAP SPREADS

Last (bps) Net

Change

(bps)

U.S. 2-year dollar swap -0.50 -3.00

spread

U.S. 3-year dollar swap -4.75 -3.50

spread

U.S. 5-year dollar swap -6.50 -2.75

spread

U.S. 10-year dollar swap -11.75 -3.25

spread

U.S. 30-year dollar swap -42.75 -4.25
spread

U.S.-China trade row sends U.S. bond yields tumbling
 

Related Articles

Add a Comment

Comment Guidelines

We encourage you to use comments to engage with other users, share your perspective and ask questions of authors and each other. However, in order to maintain the high level of discourse we’ve all come to value and expect, please keep the following criteria in mind:  

  •            Enrich the conversation, don’t trash it.

  •           Stay focused and on track. Only post material that’s relevant to the topic being discussed. 

  •           Be respectful. Even negative opinions can be framed positively and diplomatically. Avoid profanity, slander or personal attacks directed at an author or another user. Racism, sexism and other forms of discrimination will not be tolerated.

  • Use standard writing style. Include punctuation and upper and lower cases. Comments that are written in all caps and contain excessive use of symbols will be removed.
  • NOTE: Spam and/or promotional messages and comments containing links will be removed. Phone numbers, email addresses, links to personal or business websites, Skype/Telegram/WhatsApp etc. addresses (including links to groups) will also be removed; self-promotional material or business-related solicitations or PR (ie, contact me for signals/advice etc.), and/or any other comment that contains personal contact specifcs or advertising will be removed as well. In addition, any of the above-mentioned violations may result in suspension of your account.
  • Doxxing. We do not allow any sharing of private or personal contact or other information about any individual or organization. This will result in immediate suspension of the commentor and his or her account.
  • Don’t monopolize the conversation. We appreciate passion and conviction, but we also strongly believe in giving everyone a chance to air their point of view. Therefore, in addition to civil interaction, we expect commenters to offer their opinions succinctly and thoughtfully, but not so repeatedly that others are annoyed or offended. If we receive complaints about individuals who take over a thread or forum, we reserve the right to ban them from the site, without recourse.
  • Only English comments will be allowed.
  • Any comment you publish, together with your investing.com profile, will be public on investing.com and may be indexed and available through third party search engines, such as Google.

Perpetrators of spam or abuse will be deleted from the site and prohibited from future registration at Investing.com’s discretion.

Write your thoughts here
 
Are you sure you want to delete this chart?
 
Post
Post also to:
 
Replace the attached chart with a new chart ?
1000
Your ability to comment is currently suspended due to negative user reports. Your status will be reviewed by our moderators.
Please wait a minute before you try to comment again.
Thanks for your comment. Please note that all comments are pending until approved by our moderators. It may therefore take some time before it appears on our website.
Comments (1)
Kristine Castro
Kristine Castro Apr 28, 2021 12:36PM ET
Saved. See Saved Items.
This comment has already been saved in your Saved Items
I receive the money please sir
 
Are you sure you want to delete this chart?
 
Post
 
Replace the attached chart with a new chart ?
1000
Your ability to comment is currently suspended due to negative user reports. Your status will be reviewed by our moderators.
Please wait a minute before you try to comment again.
Add Chart to Comment
Confirm Block

Are you sure you want to block %USER_NAME%?

By doing so, you and %USER_NAME% will not be able to see any of each other's Investing.com's posts.

%USER_NAME% was successfully added to your Block List

Since you’ve just unblocked this person, you must wait 48 hours before renewing the block.

Report this comment

I feel that this comment is:

Comment flagged

Thank You!

Your report has been sent to our moderators for review
Continue with Google
or
Sign up with Email