Sign up to create alerts for Instruments,
Economic Events and content by followed authors
Free Sign Up Already have an account? Sign In
Please try another search
| Period Ending: | 2019 30/09 |
2019 30/06 |
2019 31/03 |
2018 31/12 |
||||||||||||||||||||||||||||||
|---|---|---|---|---|---|---|---|---|---|---|---|---|---|---|---|---|---|---|---|---|---|---|---|---|---|---|---|---|---|---|---|---|---|---|
| Total Revenue | 562.41 | 674.94 | 567.23 | 611.86 | ||||||||||||||||||||||||||||||
| ||||||||||||||||||||||||||||||||||
| Cost of Revenue, Total | 377.17 | 493.58 | 403.37 | 446 | ||||||||||||||||||||||||||||||
| Gross Profit | 185.24 | 181.36 | 163.86 | 165.86 | ||||||||||||||||||||||||||||||
| Total Operating Expenses | 532.51 | 657.35 | 539.77 | 561.95 | ||||||||||||||||||||||||||||||
| ||||||||||||||||||||||||||||||||||
| Operating Income | 29.9 | 17.59 | 27.46 | 49.91 | ||||||||||||||||||||||||||||||
| Interest Income (Expense), Net Non-Operating | -40.46 | -37.92 | -36.36 | -40.91 | ||||||||||||||||||||||||||||||
| Gain (Loss) on Sale of Assets | - | - | - | - | ||||||||||||||||||||||||||||||
| Other, Net | 1.07 | 1.35 | 0.98 | 0.5 | ||||||||||||||||||||||||||||||
| Net Income Before Taxes | -9.48 | -18.98 | -7.92 | 9.5 | ||||||||||||||||||||||||||||||
| Provision for Income Taxes | -4.02 | -6.08 | -4.61 | -4.37 | ||||||||||||||||||||||||||||||
| Net Income After Taxes | -5.47 | -12.9 | -3.31 | 13.87 | ||||||||||||||||||||||||||||||
| Minority Interest | -7.04 | -12.69 | -3.52 | -2.42 | ||||||||||||||||||||||||||||||
| Equity In Affiliates | - | - | - | - | ||||||||||||||||||||||||||||||
| U.S GAAP Adjustment | - | - | - | - | ||||||||||||||||||||||||||||||
| Net Income Before Extraordinary Items | -12.51 | -25.59 | -6.84 | 11.45 | ||||||||||||||||||||||||||||||
| Total Extraordinary Items | - | - | - | -10.9 | ||||||||||||||||||||||||||||||
| Net Income | -12.51 | -25.59 | -6.84 | 0.55 | ||||||||||||||||||||||||||||||
| Total Adjustments to Net Income | -9.63 | -9.47 | -21.4 | -6.43 | ||||||||||||||||||||||||||||||
| Income Available to Common Excluding Extraordinary Items | -22.14 | -35.06 | -28.24 | 5.02 | ||||||||||||||||||||||||||||||
| Dilution Adjustment | - | - | - | - | ||||||||||||||||||||||||||||||
| Diluted Net Income | -22.14 | -35.06 | -28.24 | -5.88 | ||||||||||||||||||||||||||||||
| Diluted Weighted Average Shares | 78.68 | 78.67 | 78.62 | 78.38 | ||||||||||||||||||||||||||||||
| Diluted EPS Excluding Extraordinary Items | -0.28 | -0.45 | -0.36 | 0.06 | ||||||||||||||||||||||||||||||
| DPS - Common Stock Primary Issue | 0.47 | 0.47 | 0.47 | 0.47 | ||||||||||||||||||||||||||||||
| Diluted Normalized EPS | -0.28 | -0.37 | -0.37 | 0.05 | ||||||||||||||||||||||||||||||

Unlock access to over 1000 metrics with InvestingPro
View advanced insights on the income statement, including growth rates and metrics that provide an in-depth view of the company's historical and forecasted financial performance.

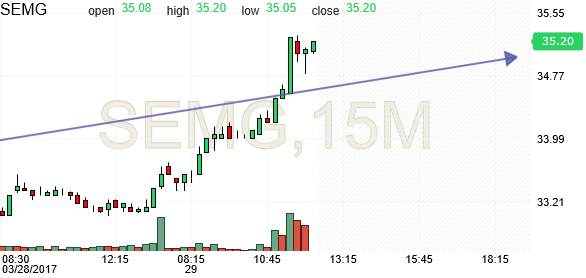
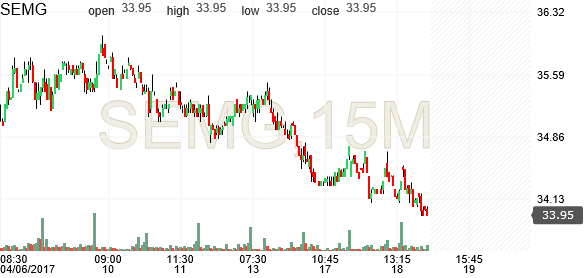
 up to $35.20 now time to put a SL and watch for a breakout above the line wile profits are locked in.
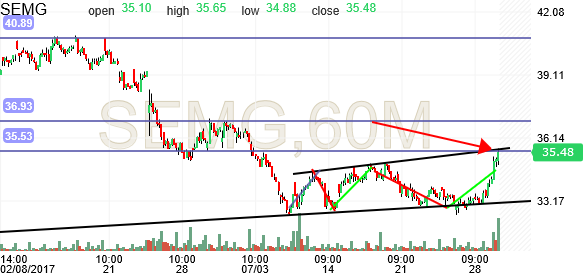
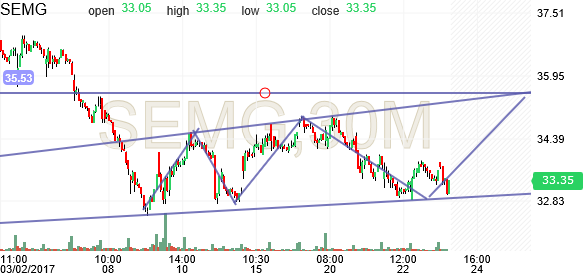
 And there you have it Target hit now to watch for breakout and upper target levels to watch for a bounce down off of.
Are you sure you want to block %USER_NAME%?
By doing so, you and %USER_NAME% will not be able to see any of each other's Investing.com's posts.
%USER_NAME% was successfully added to your Block List
Since you’ve just unblocked this person, you must wait 48 hours before renewing the block.
I feel that this comment is:
Thank You!
Your report has been sent to our moderators for review