Get 40% Off
👀 👁 🧿 All eyes on Biogen, up +4,56% after posting earnings. Our AI picked it in March 2024.
Which stocks will surge next?
Unlock AI-picked Stocks

With Reversal Happening, Let's Look At The Indexes

Published 03/01/2021, 03:46 PM
Updated 07/09/2023, 06:31 AM

With the giant reversal taking place today, let’s take a fresh look at some important indexes, in alphabetical order.

First is the Dow Jones Composite. This cracked through its trendline on Friday, but it has sprung right back above it. We’ll see if the damage done last week actually signals anything, or if this was just a one-day anomaly. My view is that the trendline break is meaningful.
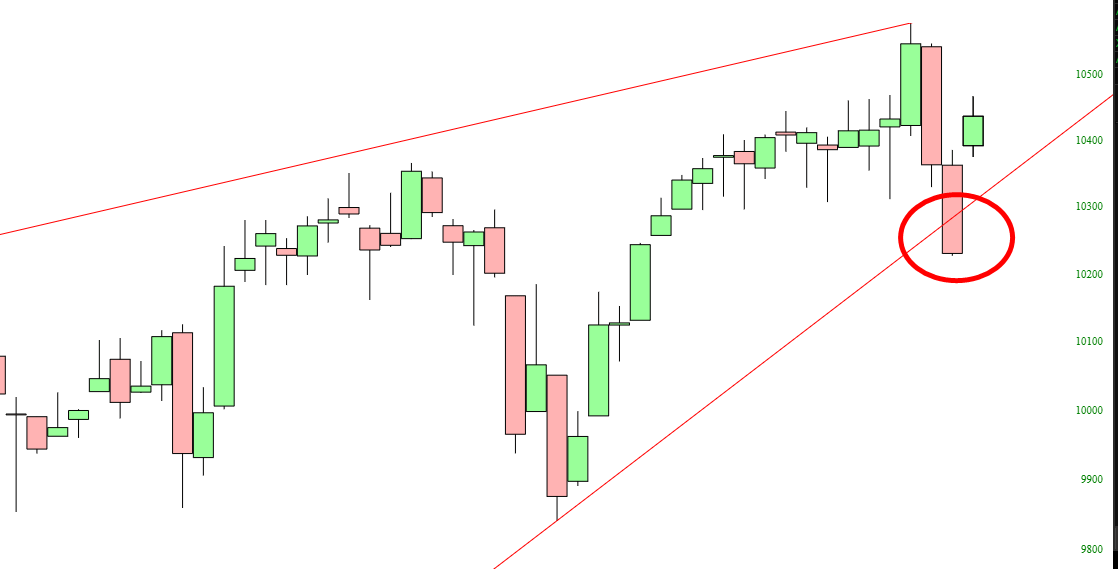
Dow Jones Composite.

The NASDAQ Composite hasn’t been quite as forgiving, since its trendline damage was much worse. It spent the entirety of last week below the broken trendline.
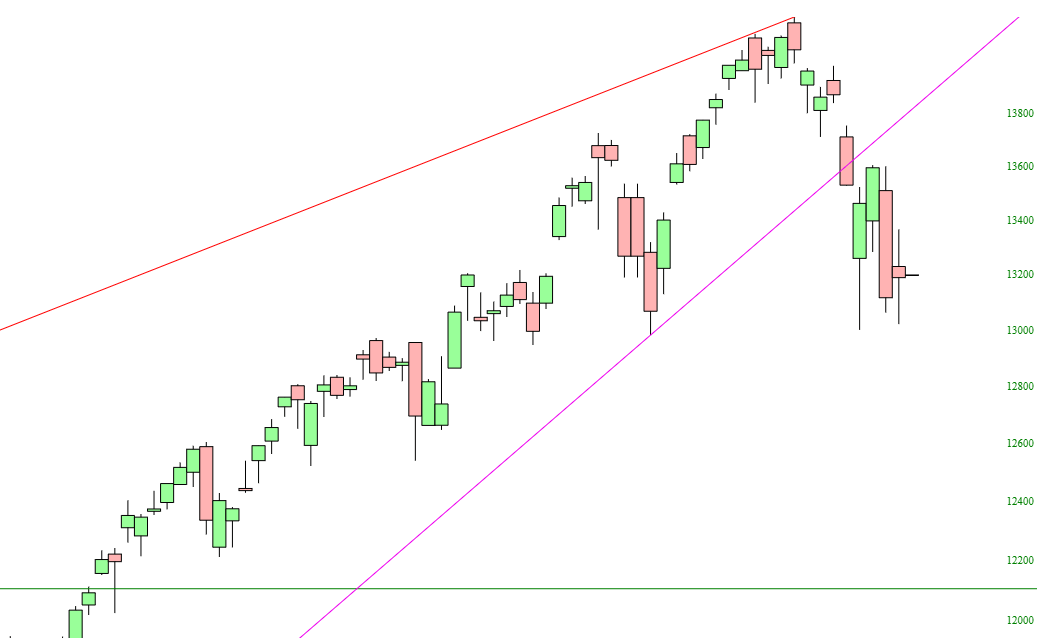
NASDAQ Composite.

Ever since Aug. 6 of last year, precious metals have stunk out loud. We might get a bounce in the Gold Bugs Index, but I think that horizontal line will be the limit.
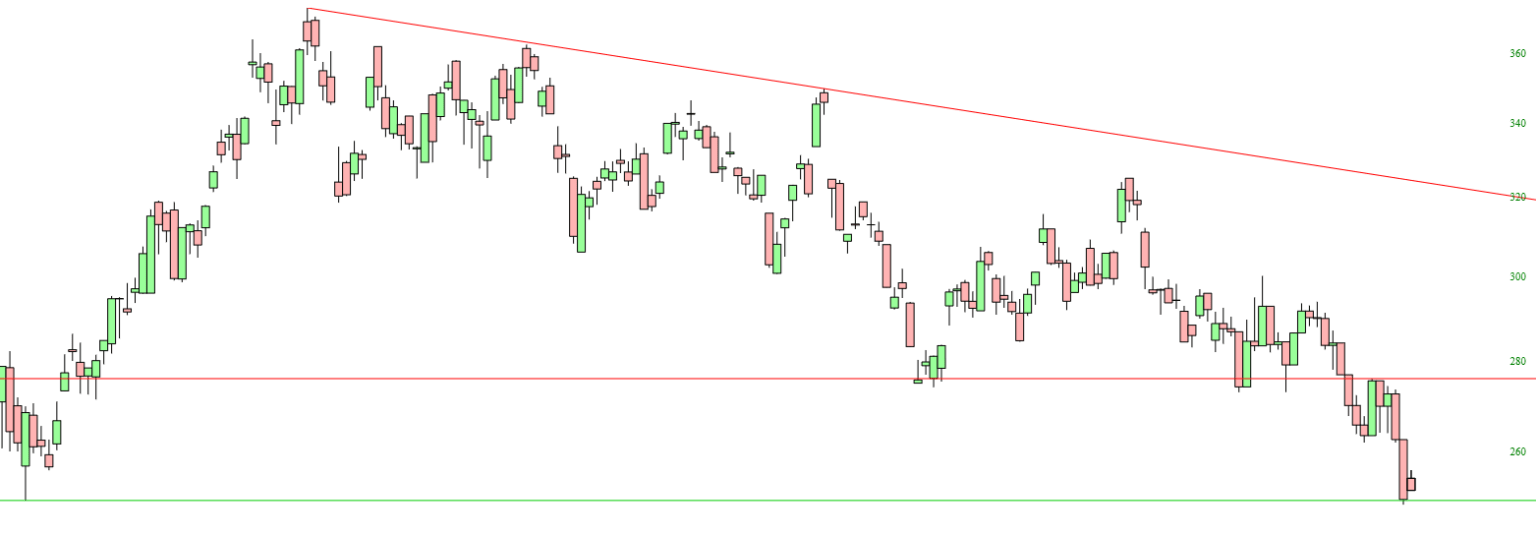
Gold Bugs Index

Similar to the $COMPQ, the NASDAQ 100, symbol Nasdaq 100, is quite plainly below broken support.
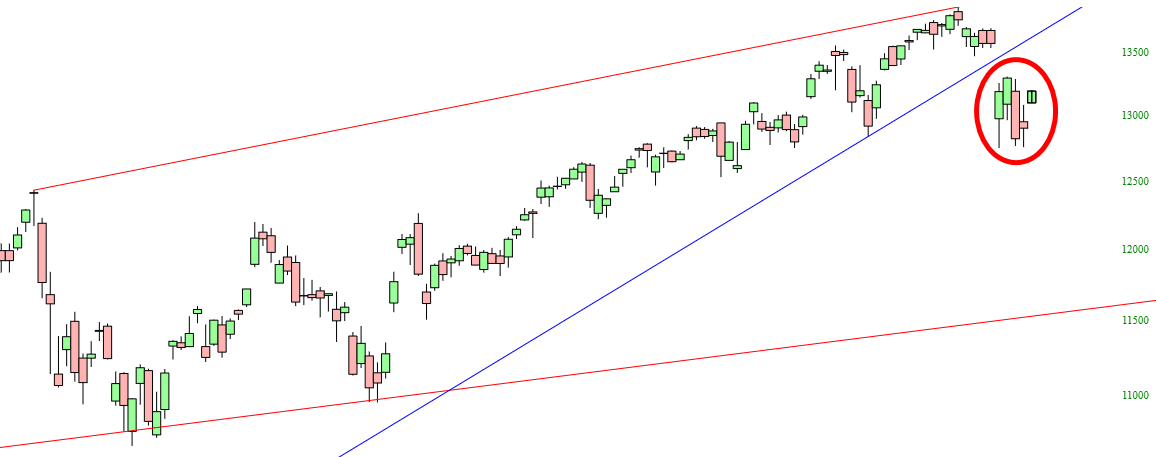
Nasdaq 100.

The S&P 100 remains below support as well, in spite of the very sizable rally this morning.
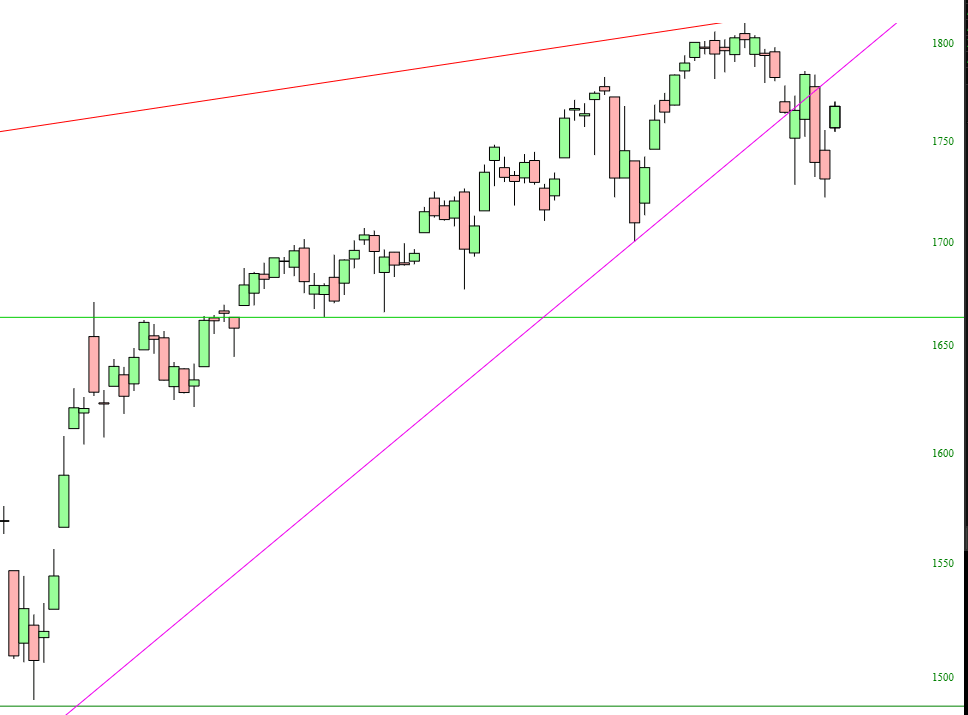
S&P 100.

The same can be said of the Russell, since last Thursday’s drop was so substantial.
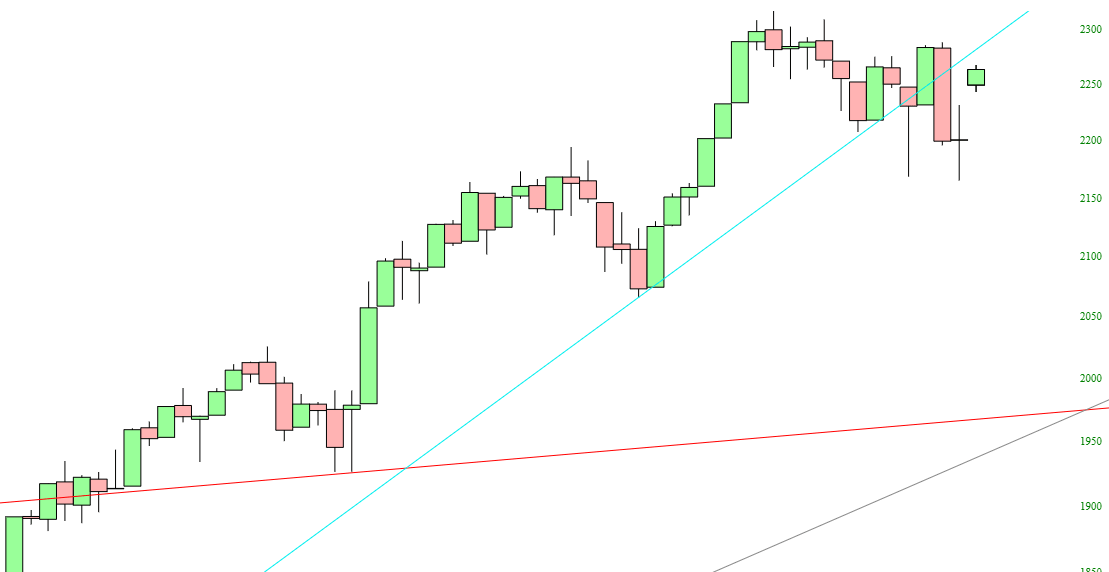
Russell 2000.

One area of resolute strength for the bulls is the semiconductor index, Philadelphia Semiconductor Index, which has been safely within its channel for going on a year now.
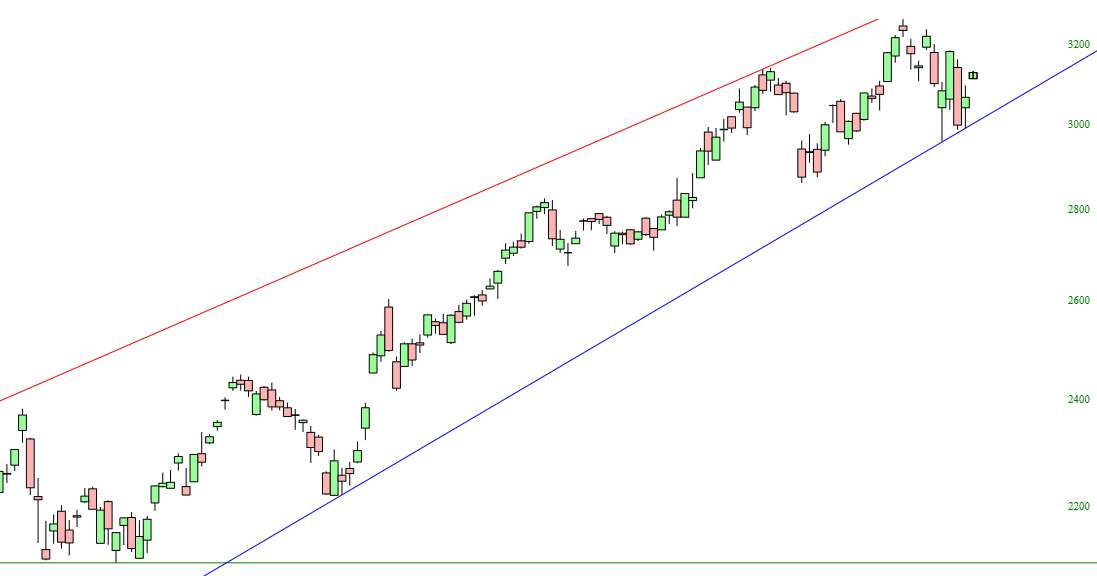
Philadelphia Semiconductor Index

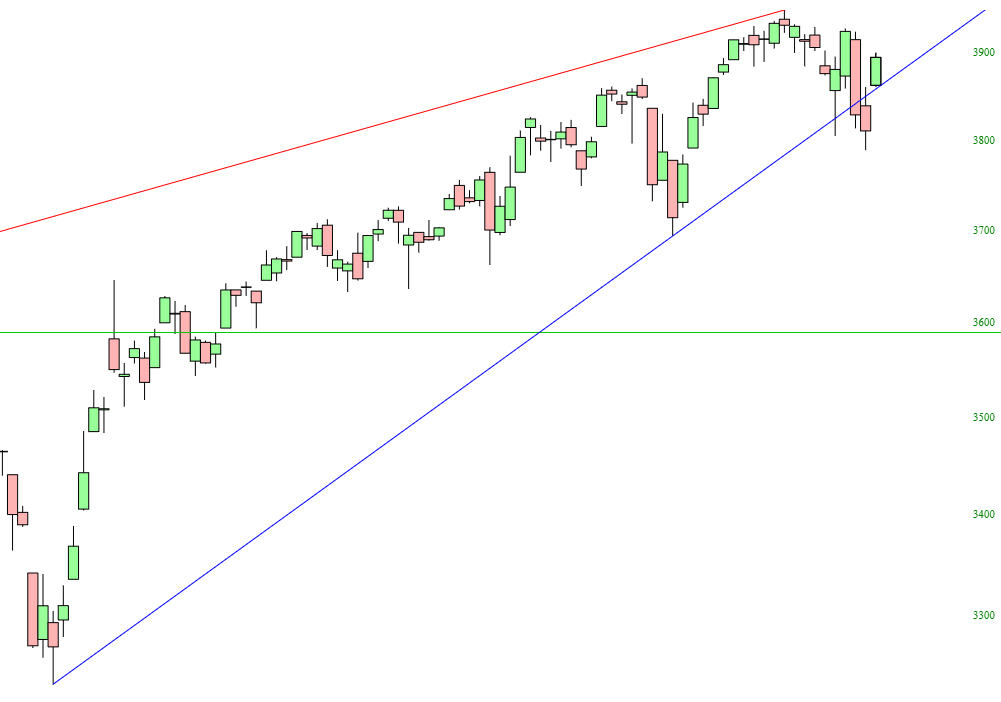
The S&P 500 teased us all a bit late last week with a trendline break, but it has clamored back above it. We are still below lifetime highs, and I think the ecstasy over the $1.9 trillion in free money that’s about to be distributed will be transitory.
3rd party Ad. Not an offer or recommendation by Investing.com. See disclosure here or remove ads .

S&P 500.

Just as the semiconductor space has been unbroken, so, too, has the Broker/Dealer Index (symbol ARCA Major Markets). We are sky-high on this.
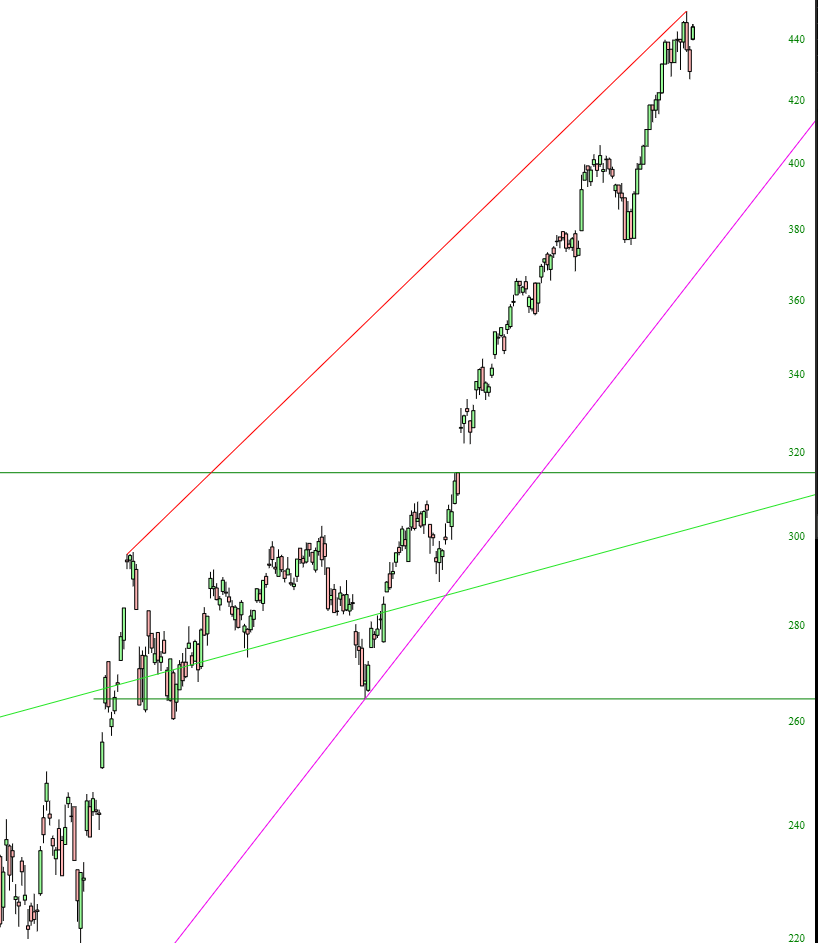
Broker/Dealer Index.

Lastly, the most vulnerable sector, in spite of all the breathless enthusiasm about crude oil, is the Oil & Gas sector (ARCA Oil). The run-up has been sensational, but that is a massive and powerful top.
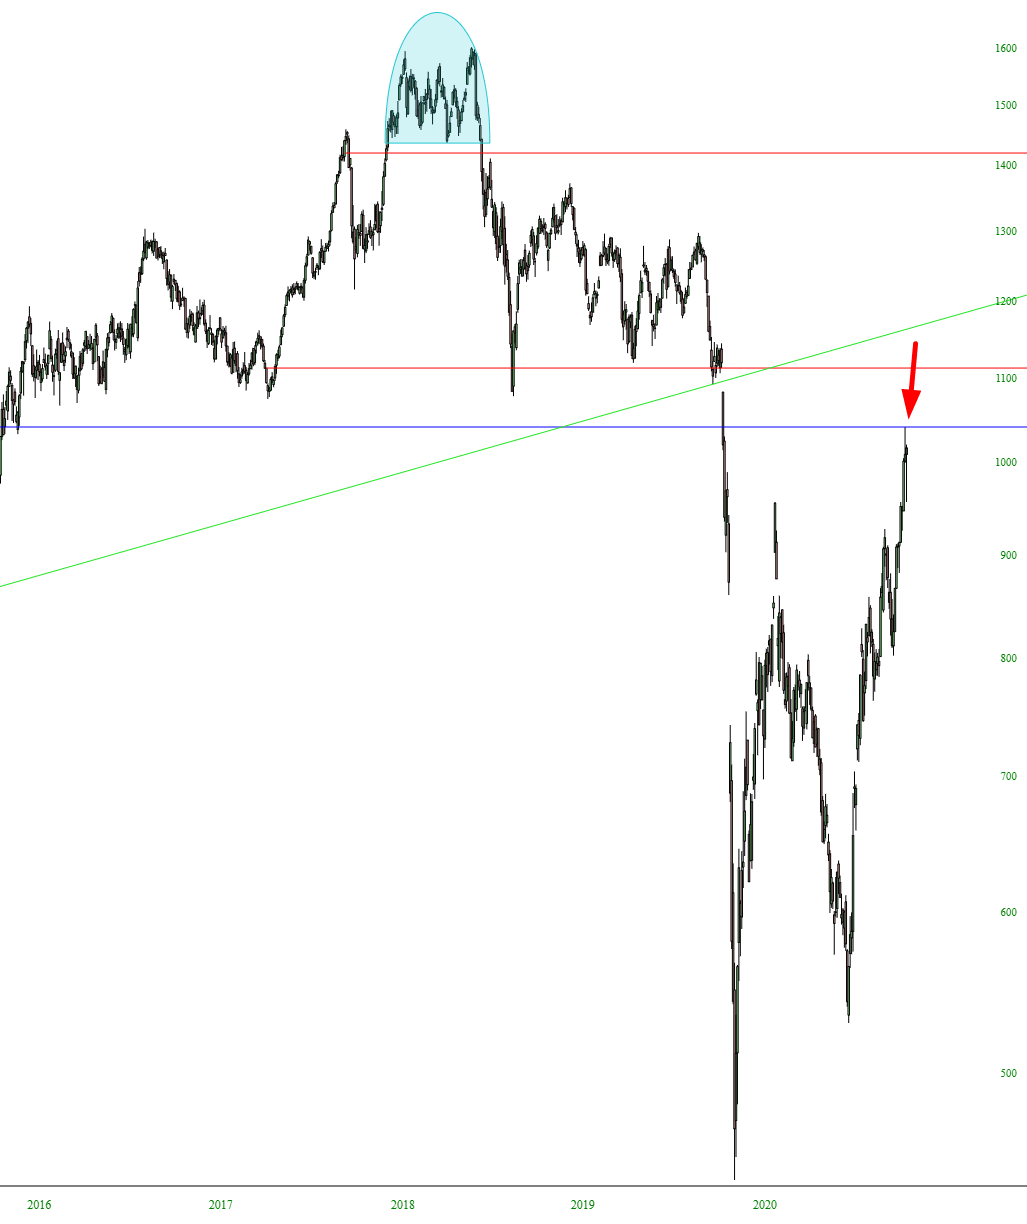
ARCA Oil Chart.

Latest comments

A concise report and summary, good article. Thanks.
The whole market is 30% higher than it should be. Its out of control And will end in tears very soon. Especially nasdaq. Its normal for you millenials who know only up. Thats NOT NORMAL
Listen. Bottom line. 12000 on nasdaq is barely a correction and YEARS OVERDUE
Thank you for the rundown on things. I do not think gloom and doom is coming. I think it is a change in market character that is quite natural and actually welcome. My take is that we are still bullish on a lot of sectors but a more cautious bull and a less steep incline. It is actually easier for me to trust a milder uptrend rather than a steep euphoric uptrend filled with the fear of a ********off top that bring an equally steep decline that can easily ruin what we try to build for quite some time
Thanks, that's very insightful.could you please include what inference for the future we can draw from this.
Much appreciated, Tim!
Thanks.
Risk Disclosure: Trading in financial instruments and/or cryptocurrencies involves high risks including the risk of losing some, or all, of your investment amount, and may not be suitable for all investors. Prices of cryptocurrencies are extremely volatile and may be affected by external factors such as financial, regulatory or political events. Trading on margin increases the financial risks.
Before deciding to trade in financial instrument or cryptocurrencies you should be fully informed of the risks and costs associated with trading the financial markets, carefully consider your investment objectives, level of experience, and risk appetite, and seek professional advice where needed.
Fusion Media would like to remind you that the data contained in this website is not necessarily real-time nor accurate. The data and prices on the website are not necessarily provided by any market or exchange, but may be provided by market makers, and so prices may not be accurate and may differ from the actual price at any given market, meaning prices are indicative and not appropriate for trading purposes. Fusion Media and any provider of the data contained in this website will not accept liability for any loss or damage as a result of your trading, or your reliance on the information contained within this website.
It is prohibited to use, store, reproduce, display, modify, transmit or distribute the data contained in this website without the explicit prior written permission of Fusion Media and/or the data provider. All intellectual property rights are reserved by the providers and/or the exchange providing the data contained in this website.
Fusion Media may be compensated by the advertisers that appear on the website, based on your interaction with the advertisements or advertisers.
© 2007-2024 - Fusion Media Limited. All Rights Reserved.