Get 40% Off
👀 👁 🧿 All eyes on Biogen, up +4,56% after posting earnings. Our AI picked it in March 2024.
Which stocks will surge next?
Unlock AI-picked Stocks

Will U.S. Banks Outperform The S&P 500 Index In 2018?

Published 01/15/2018, 05:57 AM
Updated 07/09/2023, 06:31 AM

The following monthly chart of the Financial Sector (Financial Select Sector SPDR (NYSE:XLF)) shows that it has been on a strong rally since mid-2017. It's approaching major resistance around the 30.00-31.00 level (prior all-time high and double Fibonacci retracement levels).
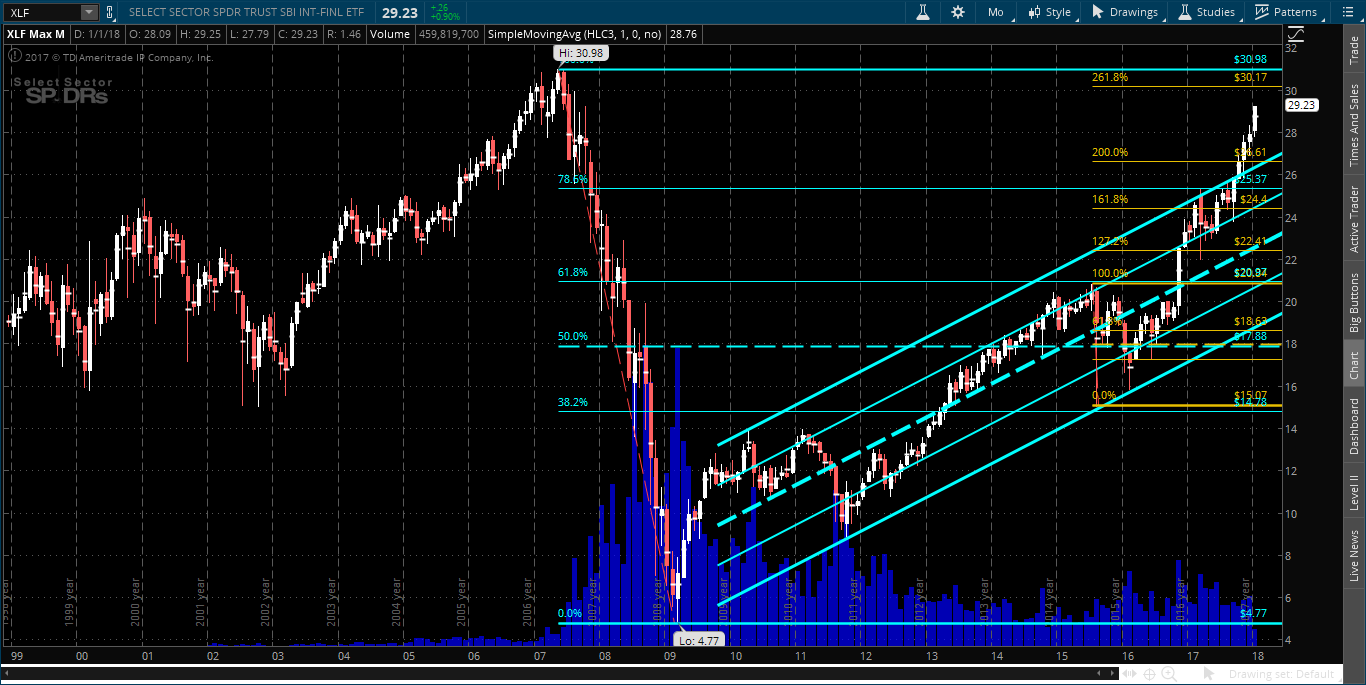
XLF Monthly Chart

The following monthly chartgrid of XLF and five of the major U.S. bank stocks (GS, C, JPM, BAC & MS) shows, at a glance, which of these stocks has, either, outperformed and made a new all-time high, or, underperformed XLF.
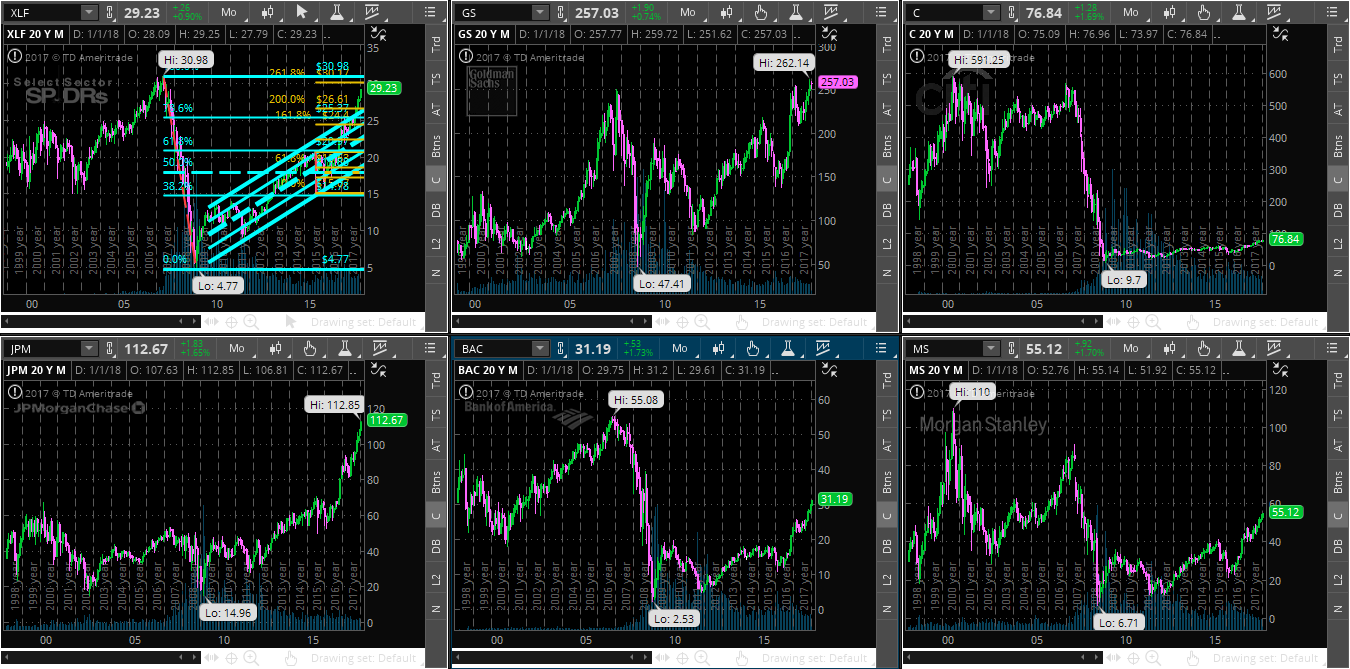
Monthly Chartgrid Of XLF

The following monthly ratio chart of XLF:S&P 500 shows that price broke out above its first major resistance level of 0.0103 (confluence of price and its 40% Fibonacci retracement level) at the end of 2017.
The next major resistance is around 0.0115 (confluence of price and its 50% Fibonacci retracement level).
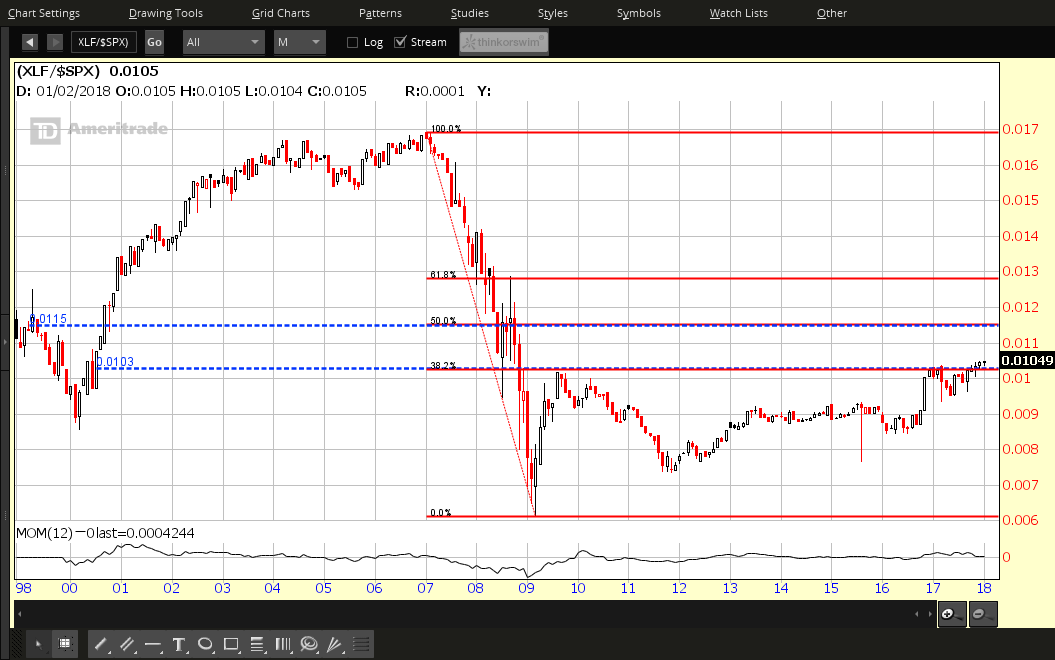
XLF:SPX Monthly Ratio Chart

Given what I said in my post of January 12 ("...the SPX may see some whip-saw action in the coming days/weeks..."), XLF may continue to outperform the SPX for, potentially, some time -- perhaps the first couple of quarters this year -- until we see further clarity of the Fed's intentions (short and longer term) regarding interest rate increases, as well as further developments in the November U.S. mid-term Congressional election, by the third quarter.


If so, keep an eye on whether:

  • XLF can continue its push to spike through, and hold above, 31.00,
  • Goldman Sachs Group Inc (NYSE:GS) and JPMorgan Chase & Co (NYSE:JPM) continue to maintain their upward momentum,
  • Citigroup Inc (NYSE:C), Bank of America Corp (NYSE:BAC) and Morgan Stanley (NYSE:MS) can strengthen their upward climb (all three have a long way to go to reach their prior all-time highs), and
  • the XLF:SPX ratio can hold above 0.0103 and climb higher

3rd party Ad. Not an offer or recommendation by Investing.com. See disclosure here or remove ads .

Latest comments

Risk Disclosure: Trading in financial instruments and/or cryptocurrencies involves high risks including the risk of losing some, or all, of your investment amount, and may not be suitable for all investors. Prices of cryptocurrencies are extremely volatile and may be affected by external factors such as financial, regulatory or political events. Trading on margin increases the financial risks.
Before deciding to trade in financial instrument or cryptocurrencies you should be fully informed of the risks and costs associated with trading the financial markets, carefully consider your investment objectives, level of experience, and risk appetite, and seek professional advice where needed.
Fusion Media would like to remind you that the data contained in this website is not necessarily real-time nor accurate. The data and prices on the website are not necessarily provided by any market or exchange, but may be provided by market makers, and so prices may not be accurate and may differ from the actual price at any given market, meaning prices are indicative and not appropriate for trading purposes. Fusion Media and any provider of the data contained in this website will not accept liability for any loss or damage as a result of your trading, or your reliance on the information contained within this website.
It is prohibited to use, store, reproduce, display, modify, transmit or distribute the data contained in this website without the explicit prior written permission of Fusion Media and/or the data provider. All intellectual property rights are reserved by the providers and/or the exchange providing the data contained in this website.
Fusion Media may be compensated by the advertisers that appear on the website, based on your interaction with the advertisements or advertisers.
© 2007-2024 - Fusion Media Limited. All Rights Reserved.