Get 40% Off
🔥 This hedge fund gained 26.16% in the last month. Get their top stocks with our free stock ideas tool.See stock ideas

Volatility Rises As Major Indices And Sectors Extend Their Gains

Published 01/14/2018, 12:08 AM
Updated 07/09/2023, 06:31 AM
US500
-
VIX
-

As can be shown on the following Year-to-date percentage gained/lost graphs, U.S. Major Indices and Sectors extended their gains into Friday's close, except for Utilities and Consumer Staples.
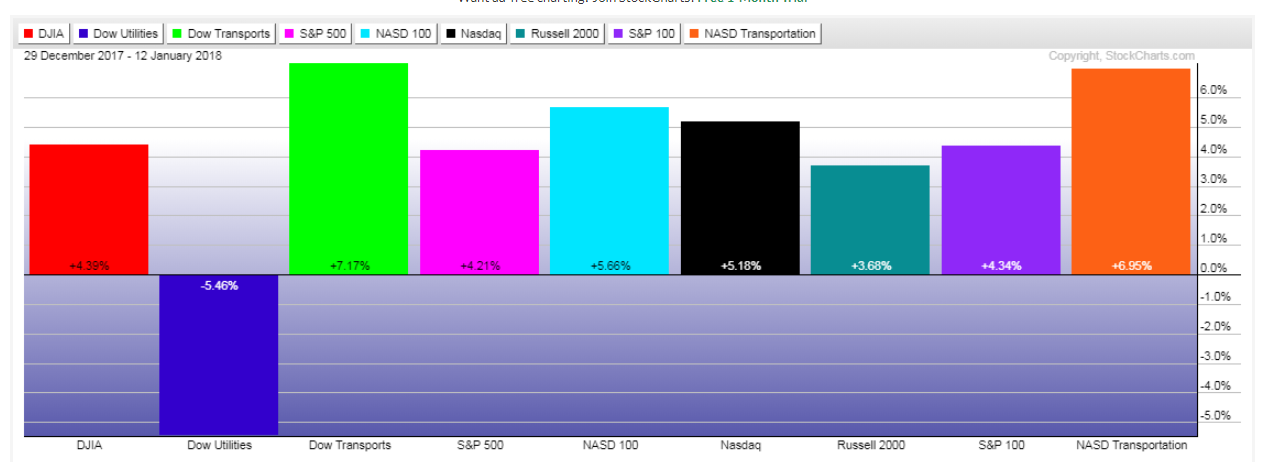
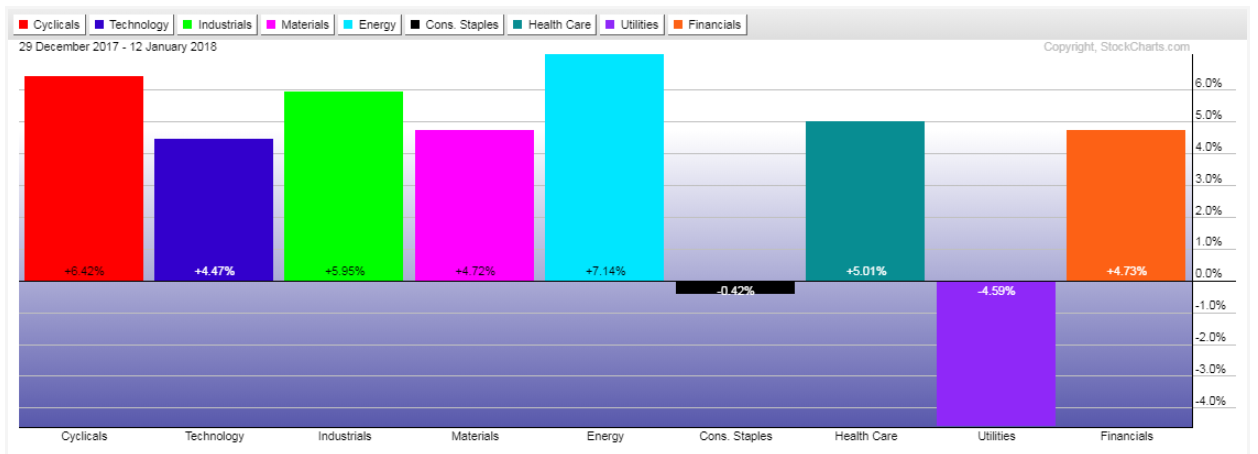
Major Indices

Major Indices

However, they did so on rising volatility, as shown on the following SPX:VIX Daily ratio chart.

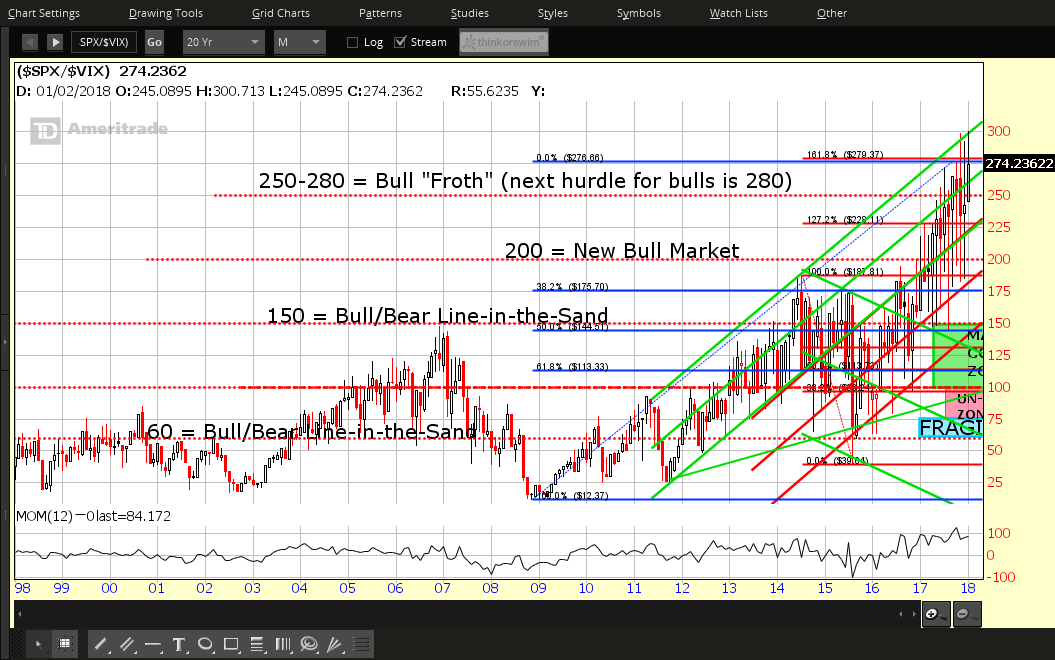
As I mentioned in my post of December 30, it will be important for price on this ratio to remain above 280 in support of a convincing argument that favours the entry of the SPX into a new bull-market phase, as shown on the following Monthly ratio chart. However, there's not a lot of wiggle room, since major resistance looms overhead at 300 (the upper edge of a long-term rising channel). So, the SPX may see some whip-saw action in the coming days/weeks...two levels to watch on this ratio.

It looks as though all 3 technical indicators are about to align and form a "SELL" signal on the daily timeframe. Watch for the RSI to drop and hold below 50, for a bearish crossover to form and hold on the PMO, and for the recent bearish crossover to hold on the MACD. Plus, if price holds below 280, we could see some weakness creep in on the S&P 500. Otherwise, we could see volatility drop, once more, while the SPX continues to rally.

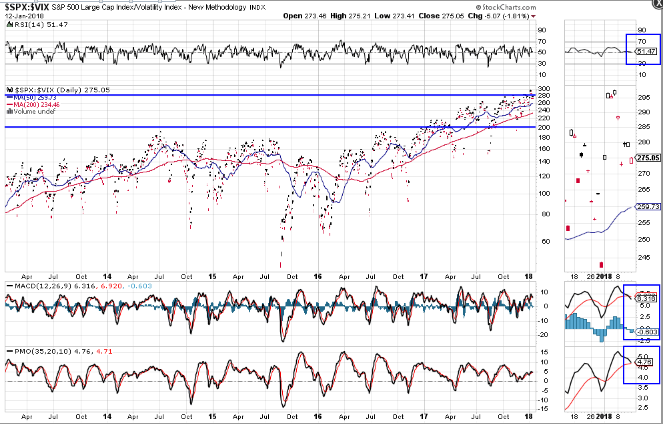
SPX:VIX Ratio DAILY

SPX:VIX Ratio MONTHLY

Latest comments

Risk Disclosure: Trading in financial instruments and/or cryptocurrencies involves high risks including the risk of losing some, or all, of your investment amount, and may not be suitable for all investors. Prices of cryptocurrencies are extremely volatile and may be affected by external factors such as financial, regulatory or political events. Trading on margin increases the financial risks.
Before deciding to trade in financial instrument or cryptocurrencies you should be fully informed of the risks and costs associated with trading the financial markets, carefully consider your investment objectives, level of experience, and risk appetite, and seek professional advice where needed.
Fusion Media would like to remind you that the data contained in this website is not necessarily real-time nor accurate. The data and prices on the website are not necessarily provided by any market or exchange, but may be provided by market makers, and so prices may not be accurate and may differ from the actual price at any given market, meaning prices are indicative and not appropriate for trading purposes. Fusion Media and any provider of the data contained in this website will not accept liability for any loss or damage as a result of your trading, or your reliance on the information contained within this website.
It is prohibited to use, store, reproduce, display, modify, transmit or distribute the data contained in this website without the explicit prior written permission of Fusion Media and/or the data provider. All intellectual property rights are reserved by the providers and/or the exchange providing the data contained in this website.
Fusion Media may be compensated by the advertisers that appear on the website, based on your interaction with the advertisements or advertisers.
© 2007-2024 - Fusion Media Limited. All Rights Reserved.