- The S&P 500's impressive surge of over 25% since late October raises questions about a potential market correction.
- While many speculate about a market bubble, historical data shows that isn't the case this time.
- In this piece, we will try and analyze the difference between an actual bubble and current market conditions.
- In 2024, invest like the big funds from the comfort of your home with our AI-powered ProPicks stock selection tool. Learn more here>>
- In 2002, a decline of 14.7% occurred over 100 days.
- In 2010, there was a 16.0% decline spanning 70 days.
- In 2011, the market experienced a 19.4% decline lasting 150 days.
- In 2015, there was a 13.3% decline over 100 days.
- In 2018, a decline of 10.2% happened in just 12 days.
- Also in 2018, a 19.8% decline occurred over 95 days.
- In 2023, a 10.3% decline happened over 85 days.
Stocks reaching new highs often suggest that more highs could be on the way. However, occasionally, the market takes a break, similar to a runner stopping after covering a long distance.
A decline, sooner or later, is considered healthy during a raging bull market. However, these are just assumptions; nobody can accurately predict corrections.
The S&P 500 has surged by more than 25% since late October last year and a correction could be in the cards.
Corrections, unlike recessions, could extend up to declines of 20%. Here's a list of market corrections since 2000:
Are We in a Market Bubble?
However, people are now calling it a bubble, even though they initially dismissed this upward trend as just a temporary market rally in late October 2023.
People tend to misinterpret the definition of a market bubble. Here's what happens at the end of a bubble: a complete collapse. Technically, there have been very few instances of such collapses. 
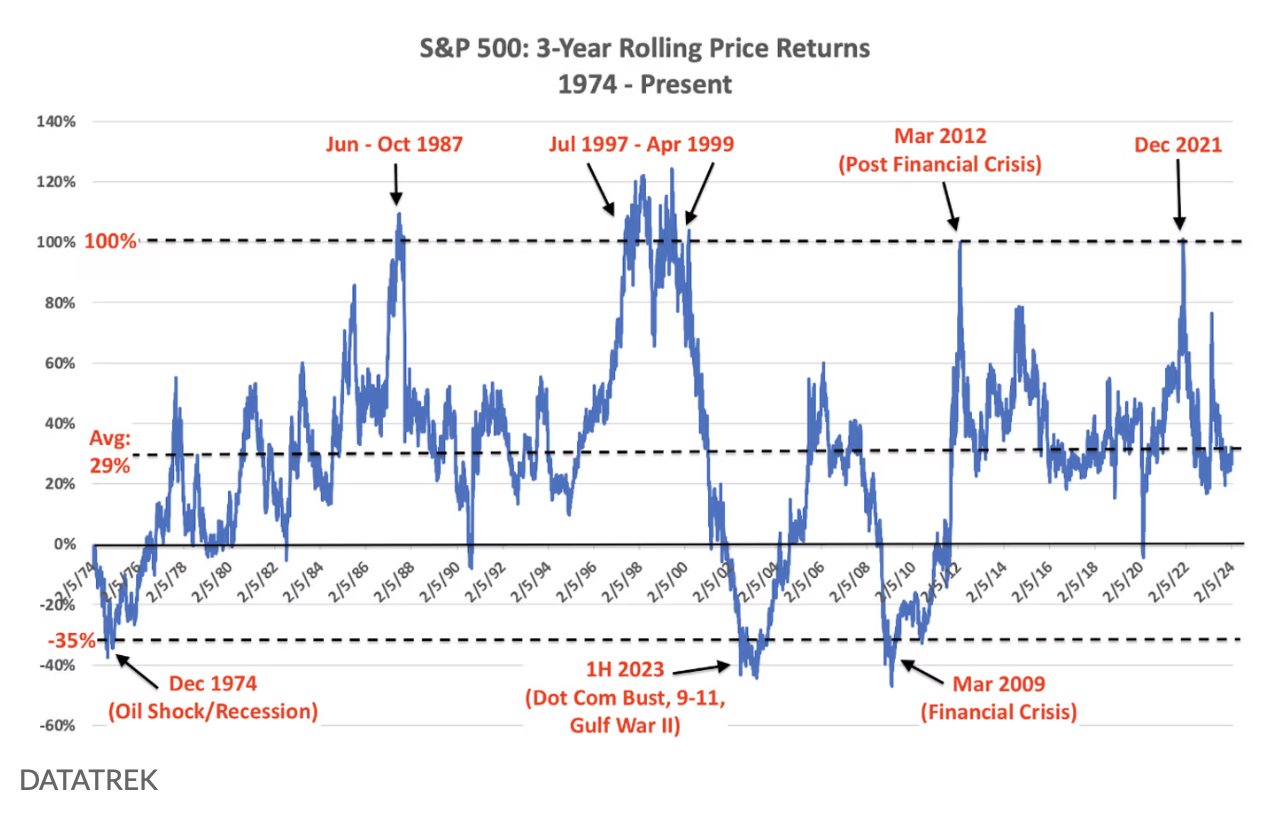
Since 1974, when the S&P 500 yielded returns of at least 100% over three years, historical data indicates instances of market bubbles (observed in 1987, 1999, 2012, and 2021).
However, in the last three years, the return has been around 30%, aligning with the general average return. This suggests that the current market condition may not be indicative of a bubble.
Tech Bubble Vs. Bull Market
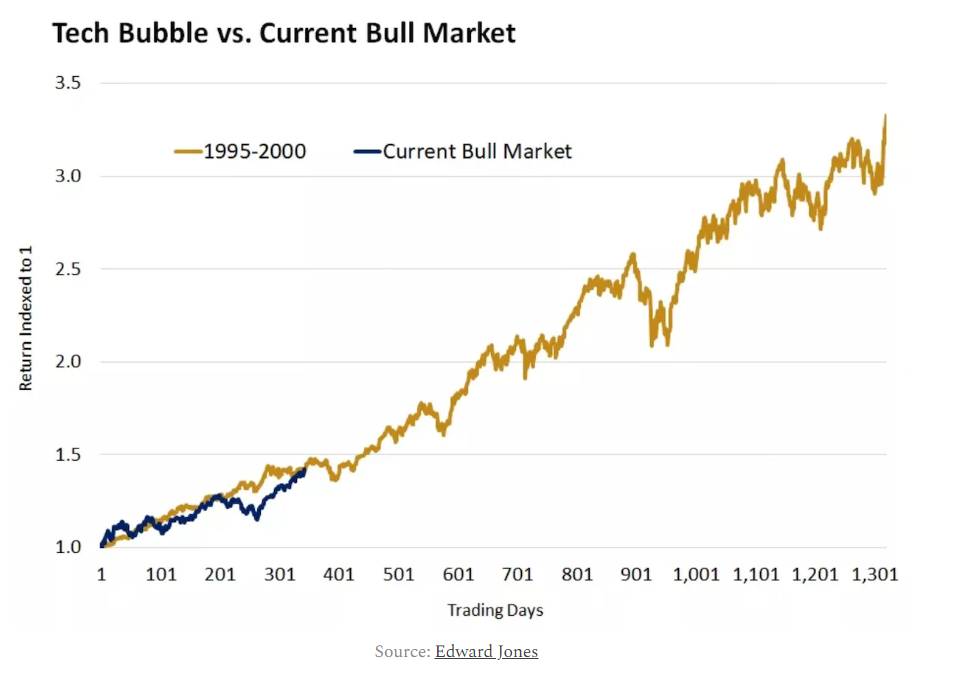
Comparing the present bullish market and the current excitement around artificial intelligence to the dot-com bubble, often cited as an example of a bubble, reveals a significant difference.
The recent returns and trends in the market indicate that there is still considerable room for growth before reaching bubble-like conditions.

The trend is in line with the past trend but it is very early, just look at the number of days that are still supposed to pass. In the 1990s there were huge gains in unprofitable dot-com companies, many of which had attractive growth prospects but no viable or sustainable profit base.
Today the enthusiasm is concentrated in the largest companies with prolific and defensible profits. Nvidia (NASDAQ:NVDA), Meta (NASDAQ:META), Apple (NASDAQ:AAPL), Amazon (NASDAQ:AMZN), Microsoft (NASDAQ:MSFT), Alphabet (NASDAQ:GOOGL) and Tesla (NASDAQ:TSLA).
***
Take your investing game to the next level in 2024 with ProPicks
Institutions and billionaire investors worldwide are already well ahead of the game when it comes to AI-powered investing, extensively using, customizing, and developing it to bulk up their returns and minimize losses.
Now, InvestingPro users can do just the same from the comfort of their own homes with our new flagship AI-powered stock-picking tool: ProPicks.
With our six strategies, including the flagship "Tech Titans," which outperformed the market by a lofty 1,183% over the last decade, investors have the best selection of stocks in the market at the tip of their fingers every month.
Subscribe here and never miss a bull market again!
Disclaimer: This article is written for informational purposes only; it does not constitute a solicitation, offer, advice, or recommendation to invest as such it is not intended to incentivize the purchase of assets in any way. I would like to remind you that any type of asset, is evaluated from multiple points of view and is highly risky and therefore, any investment decision and the associated risk remains with the investor.

