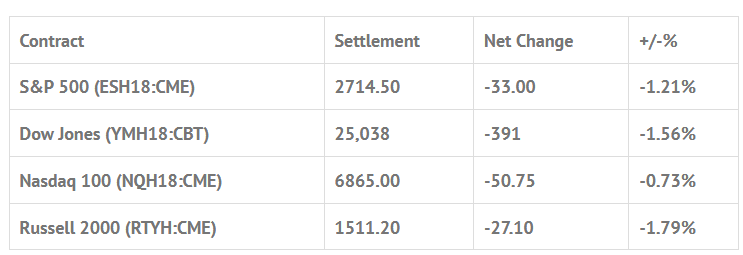
Index Futures Net Changes and Settlements:

Foreign Markets, Fair Value and Volume:
- In Asia 5 out of 11 markets closed higher: Shanghai Comp +0.44%, Hang Seng +0.65%, Nikkei -1.56%
- In Europe 12 out of 12 markets are trading lower: CAC -1.11%, DAX -1.60%, FTSE -0.75%
- Fair Value: S&P -0.15, NASDAQ +3.42, Dow -5.27
- Total Volume: 1.8mil ESH & 1.6k SPH traded in the pit
Today’s Economic Calendar:
Motor Vehicle Sales, 52-Week Bill Settlement, Jobless Claims 8:30 AM ET, Personal Income and Outlays 8:30 AM ET, PMI Manufacturing Index 9:45 AM ET, Bloomberg Consumer Comfort Index 9:45 AM ET, ISM Mfg Index 10:00 AM ET, Construction Spending 10:00 AM ET, Jerome Powell Speaks 10:00 AM ET, EIA Natural Gas Report 10:30 AM ET, William Dudley Speaks 11:00 AM ET, Fed Balance Sheet 4:30 PM ET, and Money Supply 4:30 PM ET.
S&P 500 Futures: Buy Bonds, Sell #ES, MOC Sell $3 Billion

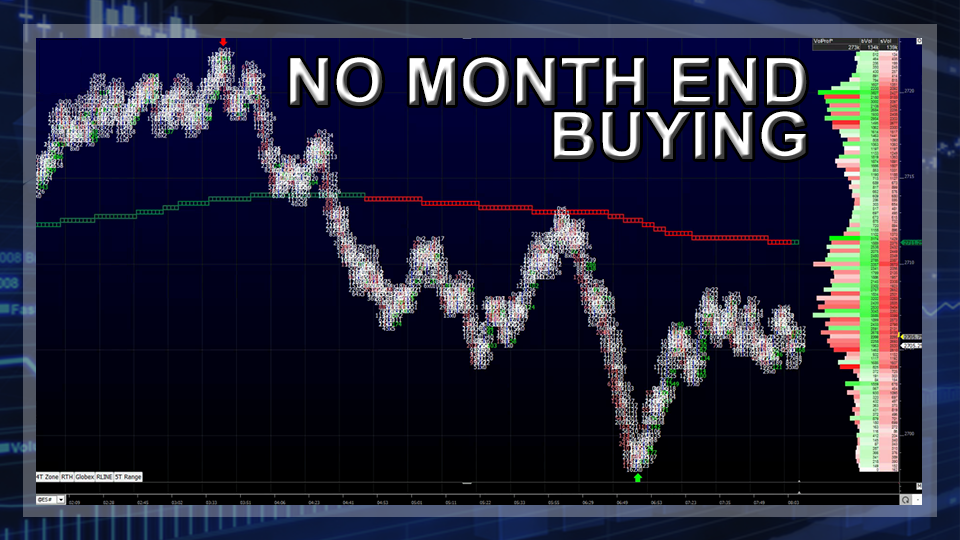
On Tuesday nights Globex session the e-mini S&P 500 futures (ESH18:CME) traded down to 2738.25 after the China PMI number fell short, but rallied all the way up to 2557.00 before Wednesdays 8:30 CT futures open. After the bell, the ES rallied up to 2762.00, and then started to fall. By 10:50 the ES had taken out the Globex low by 1.25 handles, down to 2737.25, and then stutter stepped back up to 2758.50 at 1:00, and that’s when all the BS about month end buying came to a screeching halt.
As the bonds rallied, the ES started to reverse lower. The Initial move was down to 2734.50, followed by a small bounce, and then another move down to 2727.25 at 2:25 as the MiM went from $523 million to sell to $1.5 billion to sell at 2:25. After a retrace up to 2736.00, the ES sold off down to 2721.25 on the 2:45 cash imbalance reveal, when the MiM started showing over $2.5 billion for sale. Once the imbalance came out, the ES had one last ‘pop’ up to 2727.00, and then got slammed down to 2712.00 on the 3:00 cash close. Going into the 3:15 futures close, there was a rally back up to 2721.50, and the ES went on to settle at 2719.00.
In the end, it was clear to see that the guys with the better seats did not have any buying to do at month end. It was all sells. If they did have any buying to do, it was done over the previous 3 day rally. Clearly traders continue to weigh the impact of higher interest rates on the nearly nine-year bull market.
Disclaimer: Trading Futures, Options on Futures, and retail off-exchange foreign currency transactions involves substantial risk of loss and is not suitable for all investors. You should carefully consider whether trading is suitable for you in light of your circumstances, knowledge, and financial resources. Any decision to purchase or sell as a result of the opinions expressed in the forum will be the full responsibility of the person(s) authorizing such transaction(s). BE ADVISED TO ALWAYS USE PROTECTIVE STOP LOSSES AND ALLOW FOR SLIPPAGE TO MANAGE YOUR TRADE(S) AS AN INVESTOR COULD LOSE ALL OR MORE THAN THEIR INITIAL INVESTMENT. PAST PERFORMANCE IS NOT INDICATIVE OF FUTURE RESULTS.
