Earnings season follows a familiar, four-step pattern.
- Preliminary -- Analyst estimates are too optimistic, perhaps because they "go native."
- Confession -- Adjustment and warnings as companies "pre-announce," usually when the report will be a disappointment.
- Announcement -- Actual results with explanations and outlook for the future. There is an initial market reaction to the news.
- Interpretation and Spin -- The company does a conference call where analysts either congratulate management or ask probing questions. The stock usually keeps trading during the conference call, and often provides a real-time interpretation of the management discussion.
It is often not easy to interpret. The conventional wisdom is that analysts are too bullish on earnings estimates and also set the bar too low for the actual report. Most seem not to notice that these are contradictory positions.
Rather than starting from scratch on this subject, I recommend that readers take another look at something I wrote more than two years ago. I explained one of our regular themes. Most of the punditry uses words rather than data. The key point is that the earnings story is complicated, which provides many opportunities for spinning:
Instead, there is a long laundry list of tests:
- Earnings -- comps from last year.
- Earnings -- meeting expectations.
- Earnings -- meeting the "whisper number."
- Revenues -- should meet all of the above. The market is very skeptical of earnings from cost-cutting, even though that shows smart management and can easily be reversed. It is a clear-cut bias.
- Gross margins falling -- another thing that can be wrong. Even though it might be correct to compete by cutting margins, the pundits will pounce.
- Gross margins rising -- evidence of unsustainable earnings on a long-term basis.
- Foreign sales -- another no-win area for management. If you suggest that sales were lower, then pundits will infer Europe weakness. If you try to cite currency changes, you get the opposite spin.
- Ignore current earnings. Look backward.
- Ignore forward earnings. Look backward.
- Ignore strong earnings. Look at multiple year growth estimates.
- Ignore long-term growth estimates. Those are too bullish.
The more variables, the more spin potential
Even those who are accurate in forecasting actual earnings may be losers in the short run based upon this list. I'll offer my own take in the conclusion, but first let us do our regular review of last week's news.
Background on "Weighing the Week Ahead"
There are many good lists of upcoming events. One source I especially like is the weekly post from the WSJ's Market Beat blog. There is a nice combination of data, speeches, and earnings reports.
In contrast, I highlight a smaller group of events. My theme is an expert guess about what we will be watching on TV and reading in the mainstream media. It is a focus on what I think is important for my trading and client portfolios.
This is unlike my other articles at "A Dash" where I develop a focused, logical argument with supporting data on a single theme. Here I am simply sharing my conclusions. Sometimes these are topics that I have already written about, and others are on my agenda. I am putting the news in context.
Readers often disagree with my conclusions. Do not be bashful. Join in and comment about what we should expect in the days ahead. This weekly piece emphasizes my opinions about what is really important and how to put the news in context. I have had great success with my approach, but feel free to disagree. That is what makes a market!
Last Week's Data
Each week I break down events into good and bad. Often there is "ugly" and on rare occasions something really good. My working definition of "good" has two components:
- The news is market-friendly. Our personal policy preferences are not relevant for this test. And especially -- no politics.
- It is better than expectations.
The news last week was mostly positive, including these highlights.
- The dollar death cross has triggered! For more than a year the dollar has been inversely correlated with stock prices, so this technical indicator is bearish for the dollar and bullish for stocks. See Min Zing in the WSJ for a full account.
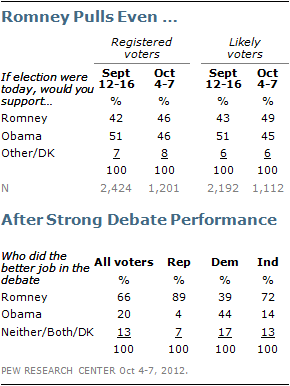
- Romney pulls even among likely voters according to the Pew Research Center, among others. (Please note the above definition of good=market-friendly. We are not cheering for either candidate. We are analyzing the implications for investments. Right or wrong, the market likes Romney). The effect did not last for even a day, however, perhaps because of some tortured logic about Romney firing Bernanke, whose term ends in January, 2014. Sites analyzing the Electoral College result still show Obama in the lead.
. This sparked more silliness about manipulation of the data. The seasonal adjustments can be tricky at this time of year, which is why we emphasize the four-week moving average. Hats off to Invictus and Barry Ritholtz (see here as well) for helping everyone keep focus on this issue. Here is a helpful chart from Calculated Risk: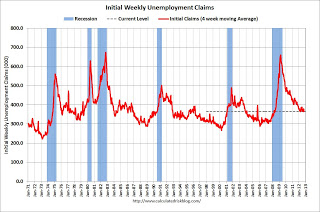
Michigan consumer sentiment spiked almost to pre-recession levels. This report deserves more respect. It is an excellent concurrent indicator, but reflecting several factors. In the last year or so the spike in gas prices and the political shenanigans have polluted the results. Normally this is a good indication of employment and consumption. For it to increase at a time when gas prices are elevated and the political silly season is in full swing is very positive for employment. Here is Doug Short's excellent chart, my favorite for this series: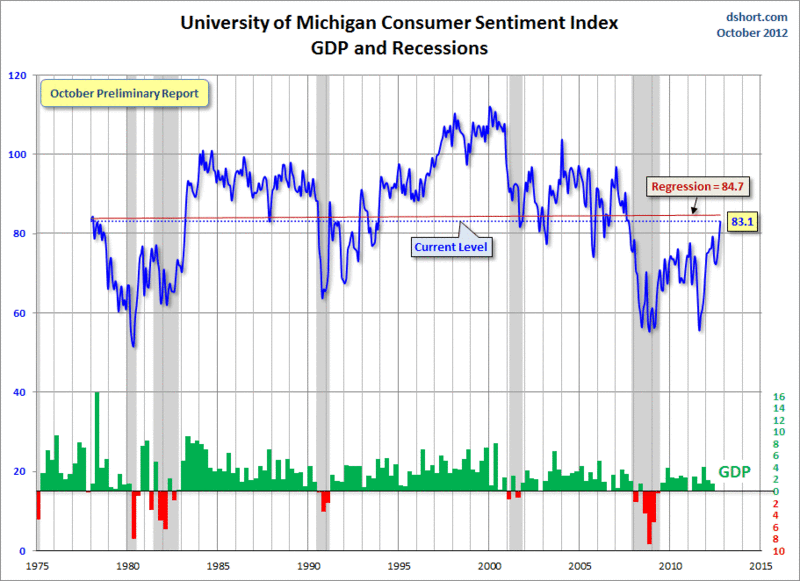
We are almost back to normal levels.
The Bad
The actual data last week was pretty good, but the stock result was bad. This happens, and it can be meaningful. Let us take a closer look.
- The world economy is weakening with the threat of a double-dip recession according to new reports from the IMF and Brookings. (via the FT).
- Insider selling sends a warning (via Mark Hulbert). I am a big fan of Mark Hulbert, but I am a little uncomfortable with this article. There are always reasons for insiders to sell, since the stock and options are part of a compensation package. (I am the chair of the comp committee for a small public company). It is also natural that selling is higher when the stock price is higher. Insider buying is a much better indicator than selling. But we should watch all indicators, so I advance this for discussion.
- The Fed Beige Book suggests only modest growth. Steven Hansen at GEI reports. His research provides an interesting compendium of Fed comments before the last two recessions, which have an eerily similar quality.
- Gasoline prices threaten the consumer. The Bonddad Blog tracks this and many other high-frequency indicators (some of which are positive). You really need to follow the complete weekly article -- just as I do:)
- The early reaction to earnings. We will know a lot more about this next week, but the early indication is intense skepticism. There seems to be a negative tone.
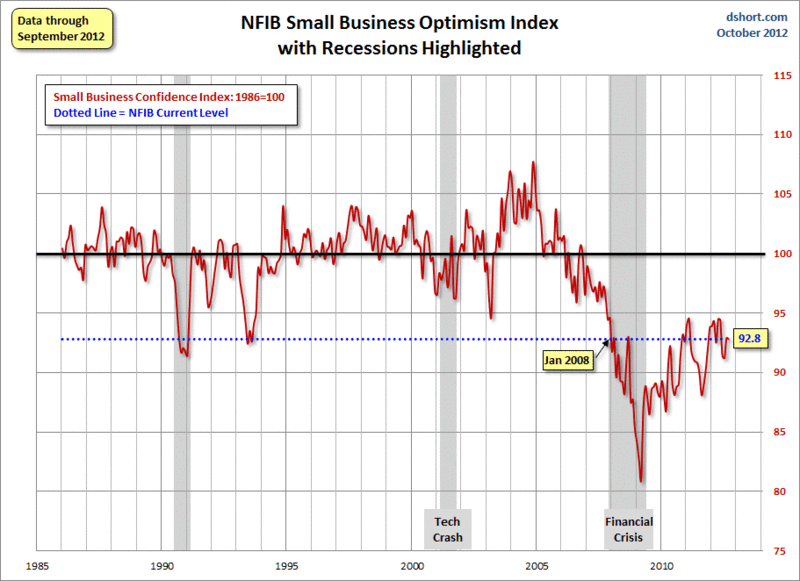
- Small business reactions and forecasts remain negative, especially from the highly partisan National Federation of Independent Businesses (NFIB). Here is a nice account from GEI, and a chart from Doug Short:
The Silver Bullet
I occasionally give the Silver Bullet award to someone who takes up an unpopular or thankless cause, doing the real work to demonstrate the facts. Think of The Lone Ranger.
This week's award goes to Cardiff Garcia at FTAlphaville for his thoughtful and reasonable analysis of the housing turnaround. It started with Roger Altman's op-ed piece in the FT has a nice explanation of why A housing boom will lift the US economy.
This is an unpopular viewpoint, so the mocking tweets started. Garcia waded into the fray with a well-timed and data-filled rebuttal. Rather than attempting a summary which could not do justice to the original post, I urge you to read it. This topic is absolutely crucial to understanding economic prospects.
The Indicator Snapshot
It is important to keep the current news in perspective. My weekly snapshot includes the most important summary indicators:
- The St. Louis Financial Stress Index.
- The key measures from our "Felix" ETF model.
- An updated analysis of recession probability.
The SLFSI reports with a one-week lag. This means that the reported values do not include last week's market action. The SLFSI has moved a lot lower, and is now out of the trigger range of my pre-determined risk alarm. This is an excellent tool for managing risk objectively, and it has suggested the need for more caution. Before implementing this indicator our team did extensive research, discovering a "warning range" that deserves respect. We identified a reading of 1.1 or higher as a place to consider reducing positions.
The SLFSI is not a market-timing tool, since it does not attempt to predict how people will interpret events. It uses data, mostly from credit markets, to reach an objective risk assessment. The biggest profits come from going all-in when risk is high on this indicator, but so do the biggest losses.
The C-Score is a weekly interpretation of the best recession indicator I found, Bob Dieli's "aggregate spread."
Bob and I recently did some videos explaining the recession history. I am working on a post that will show how to use this method. As I have written for many months, there is no imminent recession concern. I recently showed the significance of this by explaining the relationship to the business cycle.
The ECRI recession call is now over a year old. Many have forgotten that at the time of the original prediction, the ECRI claimed that the recession was already underway by September of 2011. See New Deal Democrat's carefully documented discussion, including the original video, at the Bonddad Blog.
The ECRI keeps moving the goal posts on this prediction, suggesting that we will only know about a recession after many months because the data will be revised lower. For the few die-hards who are still taking this seriously, you should read the careful, thoughtful, and data-driven work from Dwaine Van Vuuren. He is taking up the key elements in determining recessions and looking at whether revisions affected the timing of past recessions. He does this by comparing the difference between the original observations and the final revised version.
Please note that Dwaine has actually done this research, while the ECRI has not supported its claims.
Here is a key chart on employment: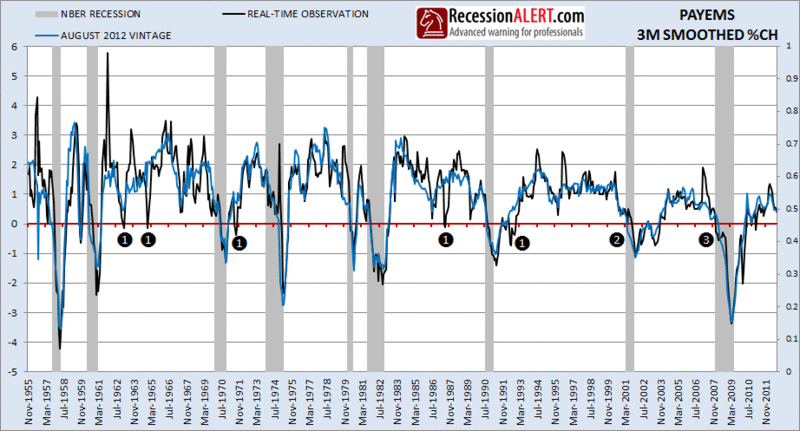
Dwaine's observations:
"The first is that the real-time data results in several false positives (false alarms) as indicated by the “1″ markings. The second observation is that for the most part, the signalling of the start of recessions is near-identical between the real-time and revised versions of the growth rate. The only exceptions are 2008 (tagged “2″), 1957 and 1959 where the revised data signalled recession earlier (meaning the real-time observer would have been late in his/her assessment that a recession was indeed underway) and point “3″ where the real-time data was actually earlier in signalling recession.
On the whole, the revised data provided earlier signalling 2 more times than the real-time data, giving it a slight edge. Whilst revised data results in a 3-month smoothed growth rate that can differ to that of the real-time growth rate, that difference seems to be isolated to the expansions and contractions, but not so much around the turning points themselves."
Dwaine's RecessionAlert service offers a free sample report. Anyone following them over the last year would have had useful and profitable guidance on the economy.
Doug Short's most recent update asks, ECRI Weekly Leading Indicators: Time to Recant the Recession Call? Doug has been an open-minded monitor of the various arguments, so his analysis deserves respect. I do question his premise this week, however. Rather than recanting the recession call, I think that the ECRI should predict the end of the recession. After all, the ECRI said that we were in a new economic era of slow growth and more frequent recessions. Their WLI has turned higher, which everyone following their data sees as good news. Maybe it is time for them to "predict" that the recession will end within the next few months!
Readers might also want to review my new Recession Resource Page, which explains many of the concepts people get wrong.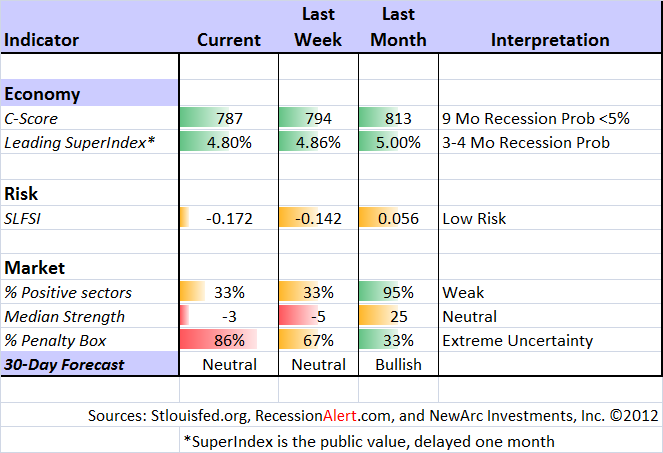
Our "Felix" model is the basis for our "official" vote in the weekly Ticker Sense Blogger Sentiment Poll. We have a long public record for these positions. This week we continued our neutral forecast. These are one-month forecasts for the poll, but Felix has a three-week horizon. Felix's ratings have continued to drift lower. The penalty box percentage measures our confidence in the forecast. That indicator is moving higher, indicating less confidence in the neutral rating. It has been a close call over the last few weeks, as the ratings moved out of bullish territory.
[For more on the penalty box see this article. For more on the system ratings, you can write to etf at newarc dot com for our free report package or to be added to the (free) weekly ETF email list. You can also write personally to me with questions or comments, and I'll do my best to answer.]
The Week Ahead
This week brings plenty of economic data, and much, much more.
The "A List" includes the following:
- The next Presidential debate (T). Playing to undecided voters in swing states.
- Initial jobless claims (Th). Extra interest after last week's "mystery" decline.
- Building permits (W). The best leading indicator for housing.
- Chinese GDP (W).
The "B" List" includes these entries:
- Retail sales (M). Confirmation of solid consumer confidence?
- Industrial production (T). Important component of economic growth.
- Housing starts (W). Widely followed, but volatile.
- Leading indicators (Th). A favorite recession indicator for some.
- Existing home sales (F). Will the bottoming in housing continue?
The other news includes regional Fed surveys from NY and Philly. I put little stock in these, but a big surprise moves the market. We also have European leaders meeting at the end of the week. and some Fed speeches.
The most important news will be earnings!
Trading Time Frame
Felix has continued the neutral posture of the last few weeks. It has been a close call between neutral and bullish for several weeks. Felix has done very well this year, becoming more aggressive in a timely fashion, near the start of the summer rally. Since we only require three buyable sectors, the trading accounts look for the "bull market somewhere" even when the overall picture is neutral. The ratings have moved lower again this week, and we are now down to one trading position, as I predicted last week. We might be completely in cash by the end of this week.
Investor Time Frame
Each week I think about the market from the perspective of different participants. The right move often depends upon your time frame and risk tolerance. Individual investors too frequently try to imitate traders, guessing whether to be "all in" or "all out."
Many have been out of the market and worry that they have missed the rally. A few months ago there were too many worries for them to invest. Now there is a fresh supply.
The traders (including Felix) are getting more cautious for a variety of reasons. Some are trying to lock in profits to earn their bonuses. Investors face a completely different problem.
Take what the market is giving you!
If you have been following our regular advice, you have done the following, in a proportion appropriate for your individual circumstances:
- Replaced your bond mutual funds with individual bonds (bond funds are very risky!)
- Sold some calls against your modest dividend stocks to enhance yield to the 10% range.
- Added some octane with a reasonable allocation of good stocks.
These opportunities are still available, but it might be a limited time offer. We have collected some of our recent recommendations in a new investor resource page -- a starting point for the long-term investor. (Comments and suggestions welcome. I am trying to be helpful and I love feedback. We have a good discussion going on bonds versus funds, and I plan a separate article that will provide a further forum.)
Final Thoughts on Earnings Season
Last week I noted that we were entering the season of fear. There was definitely a change in tone last week, with little response to good news. Stocks had the worst week in months while the data were actually somewhat positive.
Thousands of companies will report earnings in the next few weeks. When the overall earnings story is mixed, we can expect many to present a downbeat outlook. There is little reason to make bold predictions. Executives can be cautious, citing problems in Europe, China, and Washington.
The actual earnings "beat rate" will probably be close to historical norms, but the short-term outlook depends on psychology and trader sentiment. Just as it did last week, this can change swiftly.
This is why agile traders can afford to be cautious, while investors should be seizing opportunities.
