There is a lot of data to be reported in only three full trading days, but it does not rate to signal important economic changes. I expect plenty of participants to take the week off and even more will leave after the first hour on Wednesday. The punditry still has pages and air time to fill, despite the lack of fresh news. The punditry will be asking:
What are the best year-end investments?
Prior Theme Recap
In my last WTWA, I predicted that the market story would focus on the message from falling commodity prices. This thesis lasted for one day, as the market continued the multi-week trading pattern of following crude oil prices. That was all. The rest of the week included a rally that most found inexplicable. Gains occurred in the face of terrorist actions, falling commodity prices, and a strong signal of an imminent increase in interest rates. The strong rally left most participants shaking their heads and reaching to invent explanations. To get the full story, let us look at Doug Short’s weekly chart. Doug’s full post shows the various relevant moving averages in a very negative week for stocks. (With the ever-increasing effects from foreign markets, you should also add Doug’s World Markets Weekend Update to your reading list).
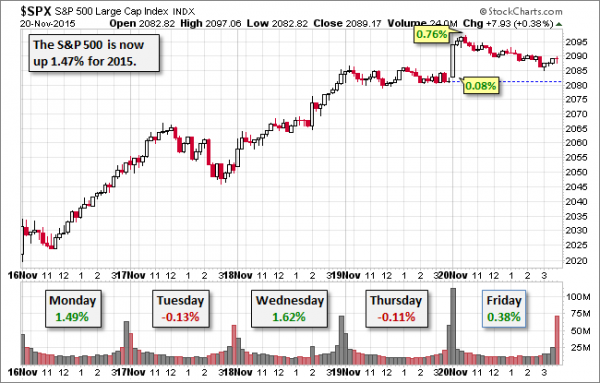
Doug’s update also provides multi-year context. See his full post for more excellent charts and analysis.
We would all like to know the direction of the market in advance. Good luck with that! Second best is planning what to look for and how to react. That is the purpose of considering possible themes for the week ahead. You can make your own predictions in the comments.
This Week’s Theme
The economic calendar is normal, but all of the reports occur within three days. Friday’s session is a half-day. Many participants will be taking off and others will leave after Wednesday morning’s data. TV producers will be reaching to find subjects. It may be the toughest week of the year to guess a theme. Volume will be low and surprise news could have a big effect. It is a bit too soon for the Santa Claus rally topic, but that is also possible.
My guess is that the discussion will focus on the surprising market resilience and what it means for investments.
People will be asking:
What are the best year-end investments?
There will be a wide range of viewpoints, featuring the following:
- Bonds. Stocks are over-priced and dangerous.
- Gold. Time to hedge against geopolitical and economic threats.
- Safe stocks, emphasizing dividends.
- Bets on an improving economy.
- A shift to emerging markets.
- Popular recent leaders.
There is an argument for each approach. Expect to see some new faces on TV and new sources featured in columns. As always, I have my own ideas, reported in today’s conclusion. This week I have tried to give special emphasis to sources with specific stock ideas.
But first, let us do our regular update of the last week’s news and data. Readers, especially those new to this series, will benefit from reading the background information.
Last Week’s Data
Each week I break down events into good and bad. Often there is “ugly” and on rare occasion something really good. My working definition of “good” has two components:
- The news is market-friendly. Our personal policy preferences are not relevant for this test. And especially – no politics.
- It is better than expectations.
The Good
There was a little good news, but most results were in line with expectations.
- More dovish commentary from ECB head Draghi. (Institutional Investor)
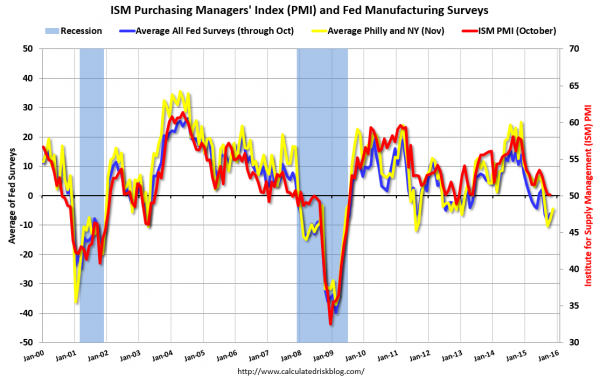
- The Philly Fed beat expectations. While the index (1.9) did not show great expansion, the results have been getting wider attention. Calculated Risk has the story and this chart showing the relationship with the more-noted ISM index.
- Bank lending strengthens. Scott Grannis has the story and a nice chart pack on credit.
- Building permits rose 45K, in line with expectations. This continues a trend in this forward-looking construction indicator. See Jill Mislinski at Doug Short’s site for more analysis and the expected great charts.
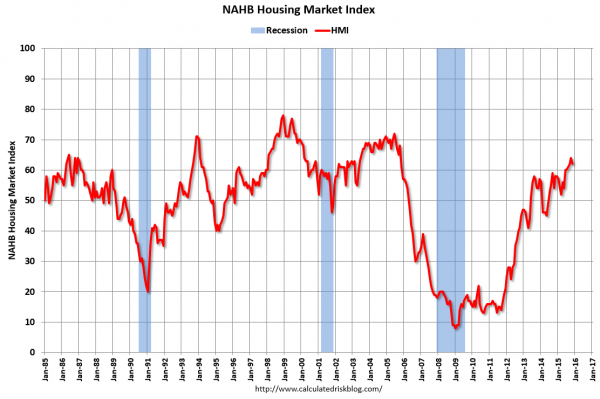
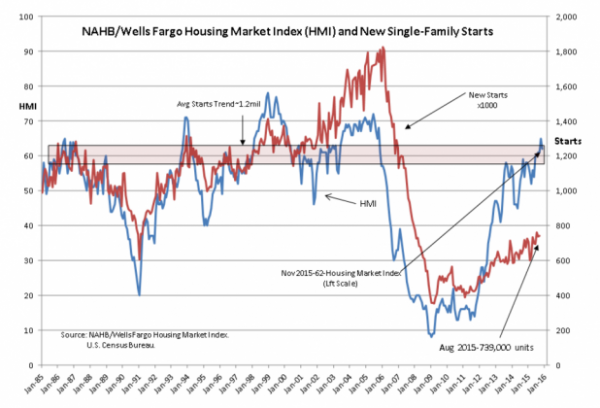
- Builder confidence was reported as 62, a slight miss of expectations. Calculated Risk notes that it is still a strong reading.
The Bad
Some of the economic data missed expectations. Feel free to add other suggestions in the comments.
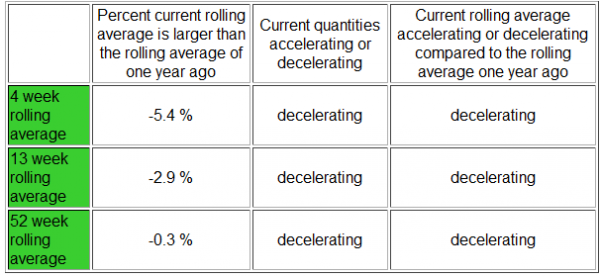
- Rail traffic is declining. Steven Hansen (GEI) gets beyond the noise of the weekly data and reveals the trend.
- Housing starts missed forecasts. Jill Mislinski at Doug Short’s site has a nice, detailed report.
- Industrial production missed explanations. Steven Hansen (GEI) takes a deeper look at the data, explaining that it might be a little better than the headline indicates.
The Ugly
Continuing terrorism. Just as those responsible for the Paris attacks were found, there was a new assault on a luxury hotel in Mali. As I write this, there is a threat to restaurants and cafes in Brussels.
This is, of course, a human story rather than one about markets. Many of us will be giving thanks this week for our own safety and that of friends and loved ones. Many will also support the victims and families in the way they best can.
I know that many are curious about why there was not a greater market impact. The Economist offers some explanations.
The Silver Bullet
I occasionally give the Silver Bullet award to someone who takes up an unpopular or thankless cause, doing the real work to demonstrate the facts. Think of The Lone Ranger. No award this week. Nominations are always welcome.
Quant Corner
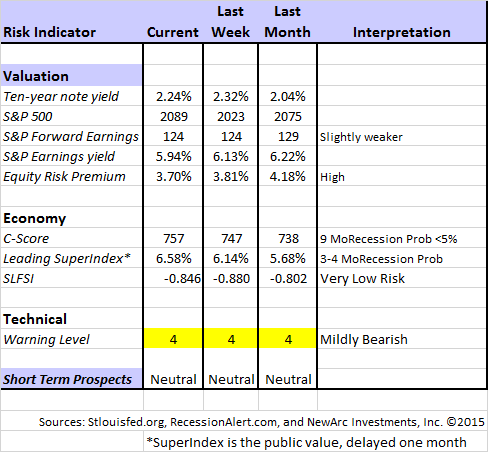
Whether a trader or an investor, you need to understand risk. I monitor many quantitative reports and highlight the best methods in this weekly update. This week I have made some changes in our regular table, separating three different ways of considering risk. For valuation I report the equity risk premium. This is the difference between what we expect stocks to earn in the next twelve months and the return from the ten-year Treasury note. I have found this approach to be an effective method for measuring market perception of stock risk. This is now easier to monitor because of the excellent work of Brian Gilmartin, whose analysis of the Thomson-Reuters data is our principal source for forward earnings.
Our economic risk indicators have not changed.
In our monitoring of market technical risk, I am using our “new” Oscar model. I put “new” in quotes because Oscar is in the same tradition as Felix and the product of extensive testing. We have found that the overall market indication is more helpful for those investing or trading individual stocks. More about Oscar next week. The score ranges from 1 to 5, with 5 representing a high warning level. The 2-4 range is acceptable for stock trading, with various levels of caution.
I considered continuing to report the Felix updates, but I already have a distinction between long and short-term methods. I want to minimize confusion. Those who want this information can subscribe to our weekly Felix updates.
For more information on each source, check here.
Recent Expert Commentary on Recession Odds and Market Trends
Bob Dieli does a monthly update (subscription required) after the employment report and also a monthly overview analysis. He follows many concurrent indicators to supplement our featured “C Score.”
Georg Vrba: An array of interesting systems. Check out his site for the full story. We especially like his unemployment rate recession indicator, confirming that there is no recession signal. He gets a similar result from the Business Cycle Indicator, updated this week.
This week Georg dropped the indicators emphasizing the ECRI WLI, which he has concluded add nothing to the forecasting power of his other approaches. He has written on this topic several times, but perhaps he will provide a summary of the factors behind his decision.
Doug Short: Provides an array of important economic updates including the best charts around. One of these is monitoring the ECRI’s business cycle analysis, as his associate Jill Mislinski does in this week’s update. The ECRI story is becoming repetitive and even more unhelpful. It seems too related to commodity prices, and only slightly changed from their failed recession forecast. It would be refreshing to see them do a complete reset and adopt a fresh approach.
RecessionAlert: A variety of strong quantitative indicators for both economic and market analysis. While we feature the recession analysis, Dwaine also has a number of interesting systems. These include approaches helpful in both economic and market timing. He has been very accurate in helping people to stay on the right side of the market.
The Week Ahead
There is quite a bit of economic data for a 3 ½ day week. Wednesday is the big day. While I highlight the most important items, you can get an excellent comprehensive listing at Investing.com. You can filter for country, type of report, and other factors.
The “A List” includes the following:
- New home sales (W). Good concurrent read on an important sector for economic growth
- Michigan sentiment (W). Good concurrent indicator of job growth and spending
- Personal income and spending (W). Can people afford holiday spending?
- Consumer confidence (T) Conference Board version is similar to Michigan’s, also showing recent strength.
- Initial claims (Th). Fastest and most accurate update on job losses.
The “B List” includes the following:
- Core PCE prices (W). The Fed’s favorite inflation indicator. Will not have much significance until there are a few hot months.
- Existing home sales (M). Not as important as new home sales, but shows the state of the market.
- GDP 2nd estimate (T). Backward looking, but probably revised higher.
- Durable goods. (W). Improvement expected in this volatile series.
- Crude oil inventories (W). Focus on oil prices keeps this report in the spotlight.
All quiet on the speaking front, but breaking news might have an exaggerated impact in the expected low-volume environment.
How to Use the Weekly Data Updates
In the WTWA series, I try to share what I am thinking as I prepare for the coming week. I write each post as if I were speaking directly to one of my clients. Each client is different, so I have five different programs ranging from very conservative bond ladders to very aggressive trading programs. It is not a “one size fits all” approach.
To get the maximum benefit from my updates, you need to have a self-assessment of your objectives. Are you most interested in preserving wealth? Or like most of us, do you still need to create wealth? How much risk is right for your temperament and circumstances?
My weekly insights often suggest a different course of action depending upon your objectives and time frames. They also accurately describe what I am doing in the programs I manage.
Insight for Traders
Oscar continues Felix’s neutral market forecast, but he is fully invested. There are often plenty of good investments, even in an expected flat market. For more information, I have posted a further description — Meet Felix and Oscar. You can sign up for Felix and Oscar’s weekly ratings updates via email to etf at newarc dot com. They appear almost every day at Scutify (follow here).
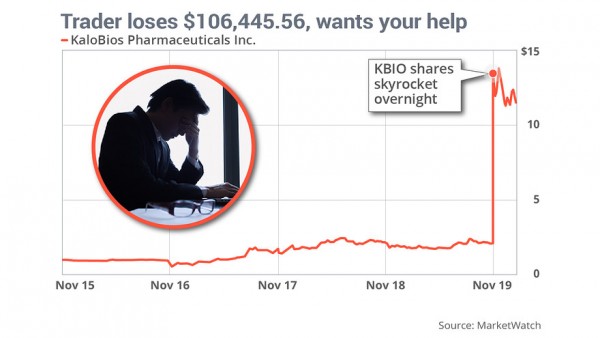
The most dramatic lesson for traders comes from a rookie who did not accurately assess his risk. He held an overnight short position in a stock that was supposedly going bankrupt. The next morning he learned that his $37,000 account was wiped out and he owed his broker over $100,000. Shawn Langlois (MarketWatch) has the story and this chart:
Insight for Investors
I review the themes here each week and refresh when needed. For investors, as we would expect, the key ideas may stay on the list longer than the updates for traders. Major market declines occur after business cycle peaks, sparked by severely declining earnings. Our methods are focused on limiting this risk. Start with our Tips for Individual Investors and follow the links.
We also have a page summarizing many of the current investor fears. If you read something scary, this is a good place to do some fact checking.
Other Advice
Here is our collection of great investor advice for this week.
If I had to pick a single most important article, it would be this analysis from Rupert Hargreaves at Value Walk. He reports on advice from Michael Mauboussin, a leading expert on investor behavior. Read the entire piece and check out the great links, but here is a key segment:
Over the past decade, the S&P 500 has gained 7.7% per annum, but the average investors has only been able to achieve a return of 5.3% per annum. According to Michael Mauboussin, these figures are similar across most of the world’s markets and can be explained by one key factor; we often fail to keep a cool head and end up we buying high and selling low.
As Mauboussin puts it, a human phenomenon is the desire to be part of a group, which gives a sense of security but it’s not always a good thing.
Many investors have the skill and tools to do well, but not the emotional stability or discipline.
SL Advisors notes that this affects asset allocation as well. The “retail” funds, ETFs, and stocks have done worse than those favored by institutions.
Russ Koesterich adds data on the “enormous long-term cost” of holding cash.
Stock Ideas
Successfully bullish strategist Thomas Lee recommends a shift from consumer discretionary stocks to energy. James Picerno analyzes this call, comparing charts and data from both sectors and providing plenty of evidence via more links.
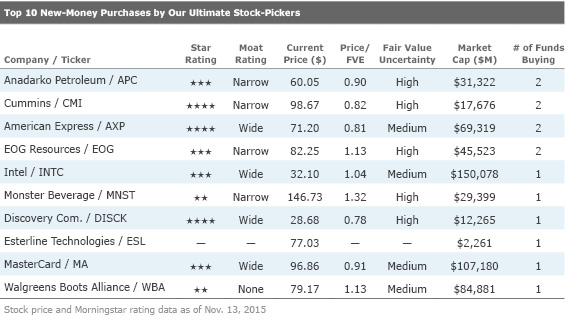
Morningstar reveals the top ten conviction buys of their “ultimate stock pickers." They also show the top ten new money purchases. Read the full article for details of both lists and some underlying rationale.
Utility stocks? Eddy Elfenbein explains the risks, and it is not just a matter of rising rates.
Big bets from the Robin Hood Conference. Valeant (N:VRX)? Oil prices to $70. There are many interesting ideas.
Warren Buffett is going against the crowd on IBM (N:IBM). But what does he know? (WSJ)
13 Dividend Aristocrats with yields over 4%. (Philip van Doorn, MarketWatch)
Watch out for….
Obamacare effects. UnitedHealth Group (N:UNH) downgraded earnings expectations, blaming the ACA. The health insurance group plummeted and the selling pressure rippled to hospitals and even to biotechs. The next day the other big insurers all stated that participation, fees, and revenues were on track. This has been a popular and important market sector, so the story deserves careful monitoring.
Tax scams. The IRS might lose your data, but they have some advice. You are probably already doing these seven things, but it only takes a moment to check.
Yield plays. MLPs, REITs, BDCs and others. (Bloomberg)
Personal Finance
Professional investors and traders have been making Abnormal Returns a daily stop for ten year. The average investor should make time (even if not able to read every day as I do) for a weekly trip on Wednesday. Tadas always has first-rate links for investors in this special edition. There are several great links, but I especially liked this warning about non-traded REITs from Micah Hauptman, financial services counsel for the Consumer Federation of America. (WSJ)
Nontraded REITs are rife with conflicts of interest both in how they are governed and how they are sold. Often, the entities that manage and sell nontraded REITS are closely affiliated and controlled by the same top executives who divvy up the high upfront costs investors pay. Further, the brokers who recommend these products are allowed to call themselves “trusted financial advisers” while they operate like salespeople seeking to earn a commission. These conflicted structures enable a systematic wealth transfer from retail investors, who need to make every dollar count, to the financial firms that create, manage, market and sell these products.
The article provides data on the huge impact of up-front fees on eventual returns.
Josh Brown offers his typically powerful comments on the same topic – a familiar one for him.
China Outlook
Another major mining company affirms Chinese economic growth rates. (Bloomberg)
Final Thoughts
For long-term investors, the best sources of value require some confidence in economic growth. This is clearly a contrarian opinion, as you can see from the sources below.
One factor influencing stocks – especially those in the economically sensitive sectors – is the persistent belief that the economy is bad and getting worse. The results of Gallup polling show this effect, despite lower gas prices and an improved economy throughout 2015. (Josh Zumbrun, WSJ)
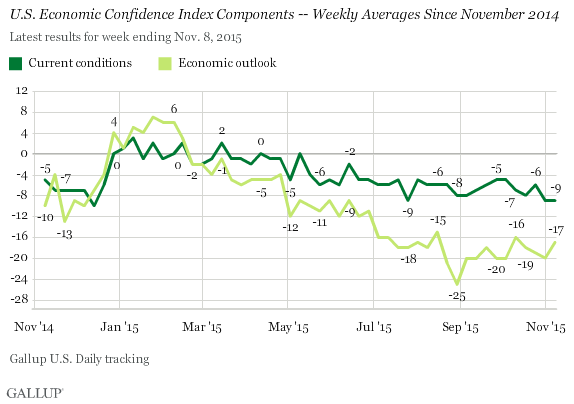
The article provides data showing the sharp contrast between this general poll and those that ask about individual circumstances.
Barry Ritholtz joins in with a nice analysis on the factors behind the unhappiness of voters – an uneven recovery, misleading noise, and ignorance, each discussed nicely. The lesson he reaches for investors his one of my favorite themes. Be politically agnostic. Accept the reality of the policy environment and take advantage of whatever is offered. This advice will become more difficult to follow as election campaigns heat up.
By contrast, “Davidson” (via Todd Sullivan) explains as follows:
The most important knowledge of Value Investors, which lets them invest when others are racing to ‘high-ground’, is in understanding that throughout human history we have always recovered from self-made disasters. Value Investors are primarily optimists and are virtually the only buyers at market recession lows. Geneticists, anthropologists, psychologists/psychiatrists and neurologists have recently been coming to similar conclusions.
He elaborates nicely, showing how this applies to housing and shelter. Here is a key chart:
Investment Conclusion
Key themes for a strengthening economy include financials (I especially like regional banks), technology, homebuilders, and mid to late stage cyclicals. While I cannot be sure that they are choices for the rest of 2015, the market seems to be swinging that way.

