Hurricane Sandy has been uppermost in everyone's concerns. We have the greatest sympathy for those who have lost loved ones, homes, and businesses. The effects of weather are often devastating in any setting. Here in the midwest, it is often a tornado that strikes with little warning. When a hurricane hits highly-populated areas, the effects are even greater.
One mission of the investment manager is to think about the financial effects and prospects no matter what else is going on. We now have more clarity about this week's schedule, so I will do my regular preview of the upcoming abbreviated week.
I see this as a three-day homestretch leading to an important inflection point -- next week's theme. The key elements are the following:
- Continuing corporate earnings reports, where a mixed story continues;
- The looming concerns over the fiscal cliff, with increasing prominence and visibility;
- The election, with potential for significant change.
I'll offer my own take on these themes in the conclusion, but first let us do our regular review of last week's news.
Background on "Weighing the Week Ahead"
There are many good lists of upcoming events. One source I especially like is the weekly post from the WSJ's Market Beat blog. There is a nice combination of data, speeches, and earnings reports. Their schedule for this week has been thrown off, of course, but it is still valuable.
In contrast, I highlight a smaller group of events. My theme is an expert guess about what we will be watching on TV and reading in the mainstream media. It is a focus on what I think is important for my trading and client portfolios.
This is unlike my other articles where I develop a focused, logical argument with supporting data on a single theme. Here I am simply sharing my conclusions. Sometimes these are topics that I have already written about, others are on my agenda. I am putting the news in context.
Readers often disagree with my conclusions. Do not be bashful. Join in and comment about what we should expect in the days ahead. This weekly piece emphasizes my opinions about what is really important and how to put the news in context. I have had great success with my approach, but feel free to disagree. That is what makes a market!
Last Week's Data
Each week I break down events into good and bad. Often there is "ugly" and on rare occasions something really good. My working definition of "good" has two components:
- The news is market-friendly. Our personal policy preferences are not relevant for this test. And especially -- no politics.
- It is better than expectations.
The economic news last week was mostly positive, including these highlights.
- Obama's Hint. During the last debate, President Obama basically dismissed the idea that the sequestration of defense funds would be allowed to happen. This was read in different ways by different observers. I think the outlines of a compromise are in place no matter who wins. Here is a good account.
- Forward earnings estimates are still strong. Brian Gilmartin follows this trend, and also notes that we lack forward revenue estimates -- the latest metric for the skeptic. Brian is very objective in his reports, and he presents important data and ideas that you do not see elsewhere.
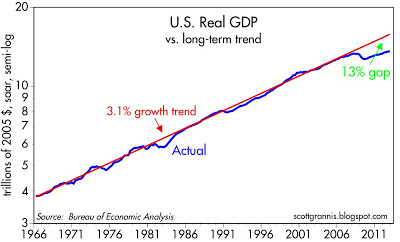
- Economic growth measured by GDP beat expectations. The 2% increase is certainly not consistent with the gloom of the recessionistas. Some immediately noted the spike in defense spending (as if the Commander in Chief could orchestrate a big spending push). Meanwhile, the drought subtracted about 0.4% from the GDP growth. The defense spending may be uneven, but housing and more normal weather will help. Scott Grannis notes that there is improvement, but that we are still well below trend.

The Bad
The actual data last week was pretty good, but the stock result was bad. This happens, and it can be meaningful. Let us take a closer look.
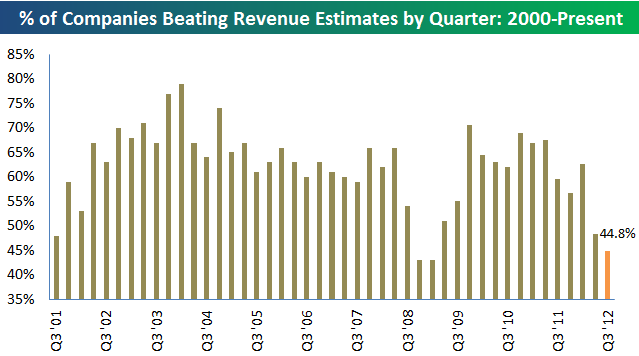
- The revenue "beat rate" is terrible. Earnings beats have been mostly in line with expectations, taking advantaged of reduced expectations, as usual. Those who think that profit margins and cost savings are unsustainable have focused on revenues. Bespoke's fine chart tells the story:

- Pending home sales were disappointing. I am scoring this as "bad" because that was the market reaction and the general commentary. Calculated Risk is not as convinced by this particular data point. Regular readers know that I favor building permits. Interpreting housing data is a challenge on many levels, partly because of the continuing distressed sales.
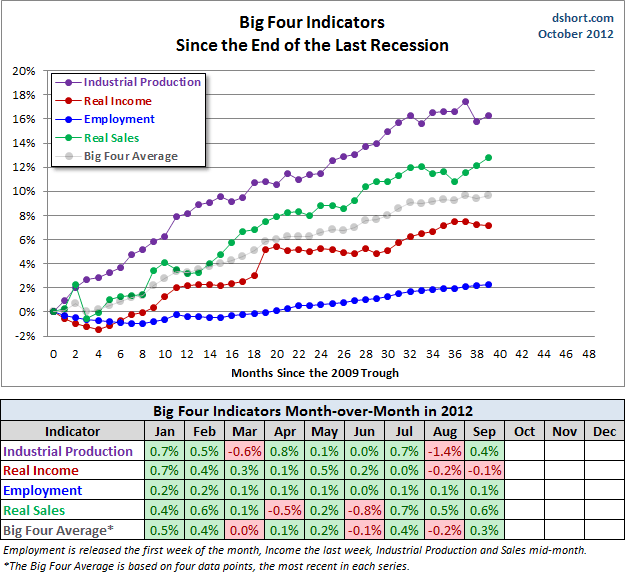
- Real income less transfer payments declined. Doug Short points out that this is more important than the nominal change in real income. Here is his crucial "big four" chart where he monitors the indicators followed by the NBER in dating recessions.

GDP growth was disappointing
. (Yes, the opposite of the entry in "the good." This is the viewpoint of Prof. Hamilton, who is not prone to spinning data to fit an agenda. Here is his take and a key chart:
The Ugly
Sandy. Enough said.
The Indicator Snapshot
It is important to keep the current news in perspective. My weekly snapshot includes the most important summary indicators:
- The St. Louis Financial Stress Index.
- The key measures from our "Felix" ETF model.
- An updated analysis of recession probability.
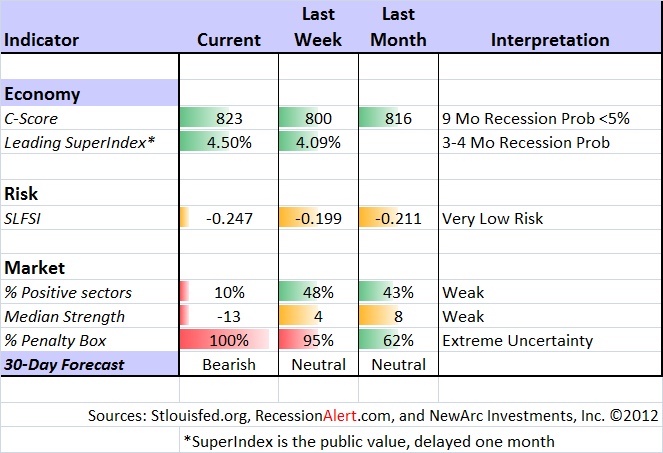
The SLFSI reports with a one-week lag. This means that the reported values do not include last week's market action. The SLFSI has moved a lot lower, and is now out of the trigger range of my pre-determined risk alarm. This is an excellent tool for managing risk objectively, and it has suggested the need for more caution. Before implementing this indicator our team did extensive research, discovering a "warning range" that deserves respect. We identified a reading of 1.1 or higher as a place to consider reducing positions.
The SLFSI is not a market-timing tool, since it does not attempt to predict how people will interpret events. It uses data, mostly from credit markets, to reach an objective risk assessment. The biggest profits come from going all-in when risk is high on this indicator, but so do the biggest losses.
The C-Score is a weekly interpretation of the best recession indicator I found, Bob Dieli's "aggregate spread."
Bob and I recently did some videos explaining the recession history. I am working on a post that will show how to use this method. Bob and I are meeting again this week to facilitate this. As I have written for many months, there is no imminent recession concern. I recently showed the significance of by explaining the relationship to the business cycle.
The ECRI recession call is now over a year old. Many have forgotten that at the time of the original prediction, the ECRI claimed that the recession was already underway by September of 2011. See New Deal Democrat's carefully documented discussion, including the original video, at the Bonddad Blog.
RecessionAlert offers a free sample report. Anyone following them over the last year would have had useful and profitable guidance on the economy.
The most recent news from the ECRI states that they are "Assessing the Current Optimism." This is apparently available only to paid subscribers, the ones who had early access to the 2011 forecast.
The public will await this report with some interest. Meanwhile, their WLI has turned higher, which everyone following their data sees as good news. Maybe it is time for them to "predict" that the recession will end within the next few months!
Readers might also want to review my new Recession Resource Page, which explains many of the concepts people get wrong. 
Our "Felix" model is the basis for our "official" vote in the weekly Ticker Sense Blogger Sentiment Poll. We have a long public record for these positions. This week we shifted to a bearish position, but it was a pretty close call. These are one-month forecasts for the poll, but Felix has a three-week horizon. Felix's ratings have continued to drift lower. The penalty box percentage measures our confidence in the forecast. That indicator has moved to the top of the range, indicating little confidence in the current bearish rating. It has been a close call over the last few weeks.
[For more on the penalty box see this article. For more on the system ratings, you can write to etf at newarc dot com for our free report package or to be added to the (free) weekly ETF email list. You can also write personally to me with questions or comments, and I'll do my best to answer.]
The Week Ahead
This week brings a little economic data.
The "A List" includes the following:
- The employment situation report (F). This is the big news of the week, especially given the brouhaha over last month's decline in unemployment. It has now been confirmed that despite Sandy, the report will be released on schedule.
- Initial jobless claims (Th). Continuing strong interest after the results from the last three weeks.
- The ISM index (F). An important economic read for most observers.
The "B" List" includes these entries:
- Personal income and spending (M). Reported on Monday despite Sandy. Better than expected on spending.
- ADP private sector jobs (Th). I respect this as an alternative employment methodology.
- Consumer Confidence (Th)). The Conference Board moved the release because of Sandy.
- Case-Shiller home prices (T). Released on schedule, and showing improvement.
Most important will be many more earnings reports from a wider variety of sectors. Some of these reports were delayed from the Monday-Tuesday time frame. We also will have the Chicago PMI, auto sales data, and some Fed speeches.
Trading Time Frame
Felix has shifted to a bearish posture. It has been a close call for several weeks, but it is now turning more negative. Felix has done very well this year, becoming more aggressive in a timely fashion, near the start of the summer rally. Since we only require three buyable sectors, the trading accounts look for the "bull market somewhere" even when the overall picture is neutral. The ratings have moved lower again this week. While inverse ETFs have higher ratings than the broad market, everything is in the penalty box. This means that we continue with no position. Felix can go short (via the inverse ETFs) if a downtrend continues.
Investor Time Frame
Each week I think about the market from the perspective of different participants. The right move often depends upon your time frame and risk tolerance. Individual investors too frequently try to imitate traders, guessing whether to be "all in" or "all out."
The traders (including Felix) are getting more cautious for a variety of reasons. Some are trying to lock in profits to earn their bonuses. Investors face a completely different problem.
Most people are not very agile in "chasing" a big move. They instead engage in a sort of wishful thinking that leads to bad decisions. If a stock declines they wish they had sold. Instead of treating each day as a new beginning, they watch to see if the stock regains the old price. Then they sell! On a logical basis, selling when a company has generated success is probably wrong, but that is psychology at work. This is part of the reason for not trying to time the market at these inflection points, especially with your entire account.
I'll go into this more deeply next week.
We have collected some of our recent recommendations in a new investor resource page -- a starting point for the long-term investor. (Comments and suggestions welcome. I am trying to be helpful and I love feedback. We have a good discussion going on bonds versus funds, and I plan a separate article that will provide a further forum.)
Final Thoughts on the Homestretch
In the last few weeks I have noted that we were entering the season of fear. There has been a change in tone, with little response to good news. Stocks have done poorly despite improved economic data.
When the overall earnings story is mixed, we can expect many executives to present a downbeat outlook. There is little reason to make bold predictions. Executives can be cautious, citing problems in Europe, China, and Washington.
I see continuing evidence that businesses are cautious while waiting for a resolution to the "fiscal cliff."
In a few days, there will be a lot less uncertainty. Markets hate uncertainty -- and so do businesses.
