As I wrote in my preview two weeks ago, we needed to expect a period with more noise than signal. The post-election posturing and the effects of Sandy have left investors with less real data than usual. In the next few weeks we may finally get some clarity.
This week may provide better policy definition from the Fed. Despite the Bernanke-era emphasis on policy transparency, the message from the Fed still seems far from clear.
Perhaps because it fits a convenient story, much financial commentary puts a strange twist on current policy. This was partly due to the election, where the Fed became an issue. This distraction for investors is over. It may now be easier to emphasize the facts.
Here are some common mistakes by the Fed punditry:
- The Fed is out to punish cautious investors, pushing them into risky assets;
- The Fed is targeting asset prices;
- The Fed has engaged in boundless money printing;
- The Fed is out of ammunition;
- The Fed is watching each new release, prepared to change course.
These are all incorrect.
I'll offer my own take on what to expect from the Fed in the conclusion. Let us first do our regular review of last week's news and data.
Background on "Weighing the Week Ahead"
There are many good lists of upcoming events. One source I especially like is the weekly post from the WSJ's Market Beat blog. There is a nice combination of data, speeches, and other events.
In contrast, I highlight a smaller group of events. My theme is an expert guess about what we will be watching on TV and reading in the mainstream media. It is a focus on what I think is important for my trading and client portfolios.
This is unlike my other articles, where I develop a focused, logical argument with supporting data on a single theme. Here I am simply sharing my conclusions. Sometimes these are topics that I have already written about, and others are on my agenda. I am putting the news in context.
Readers often disagree with my conclusions. Do not be bashful. Join in and comment about what we should expect in the days ahead. This weekly piece emphasizes my opinions about what is really important and how to put the news in context. I have had great success with my approach, but feel free to disagree. That is what makes a market!
Last Week's Data
Each week I break down events into good and bad. Often there is "ugly" and on rare occasion something really good. My working definition of "good" has two components:
- The news is market-friendly. Our personal policy preferences are not relevant for this test. And especially -- no politics.
- It is better than expectations.
The economic news last week was mostly good.
- Initial jobless claims returned to the 370K range. The news might be even better. New Deal Democrat from The Bonddad Blog did some great original research. He took the state-by-state data, dropped NY and NJ as a basic "Sandy adjustment" and came up with 339K! Read the full post. We'll all be watching the upcoming series closely.
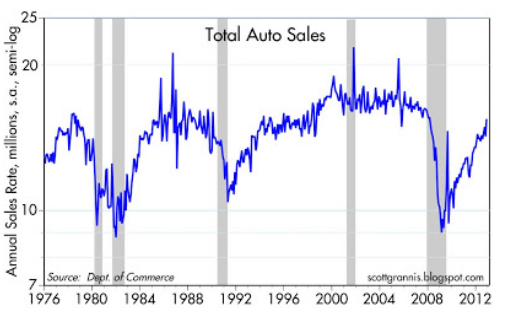
- Car Sales have been great. (via Scott Grannis).
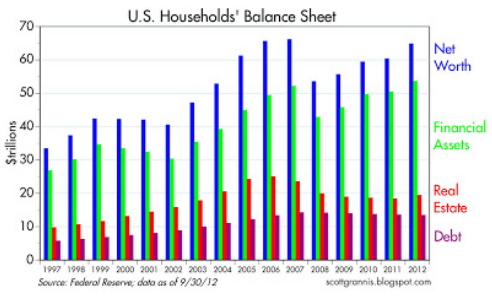
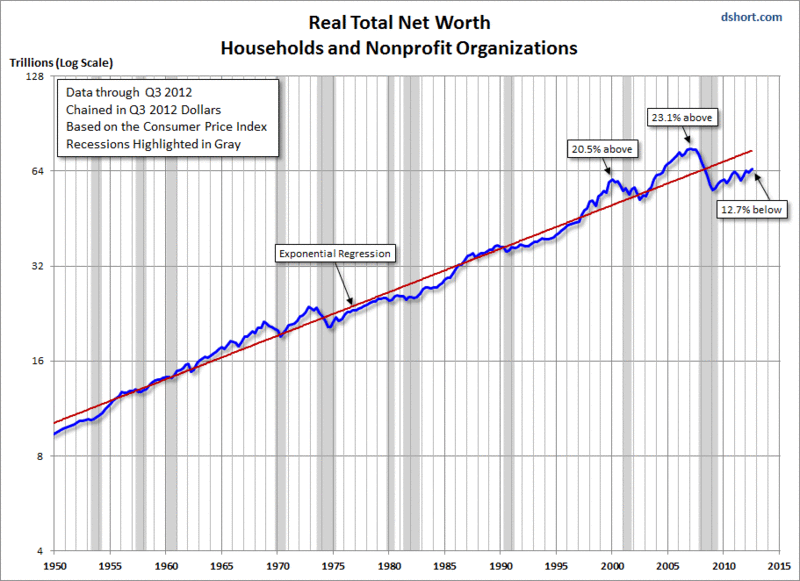
- Household wealth has rebounded. This is basically good news, as I show in the first chart from Scott Grannis. The second chart provides an inflation-adjusted historical context from Doug Short. Both perspectives are helpful. The nice improvement has not taken us back to pre-recession levels.
- ISM Services Index is stronger. The services sector may be more important to watch. Check out the comprehensive analysis from Steven Hansen at GEI.
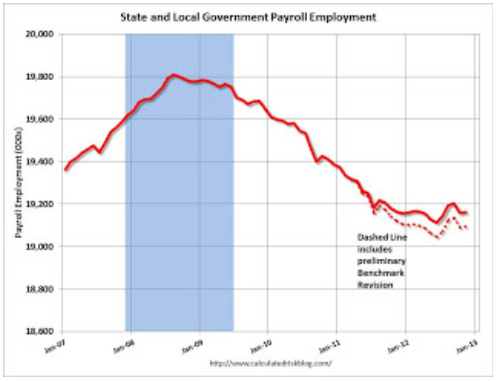
- The Employment Report beat expectations (including mine). Most of us thought there would be more of a Sandy effect, but the official survey period for the establishment report seemed to miss the dates of the worst effects. There was more of an effect on the Household survey. The market applauded the overall job gain, but careful observers have some reservations. Prior month revisions reduced the gain closer to expectations. The decline in the unemployment rate was mostly due to people leaving the labor force. Bottom line: Jobs are growing at 150K a month, slower than the 200K or so at the start of the year. It is not a recession, but also not enough growth. Long-term employment is worse. One bright spot is improvement in state and local government trends. Reductions there have been subtracting jobs for several years. The private job growth has been closer to past recoveries. Calculated Risk shows the significance of this effect.
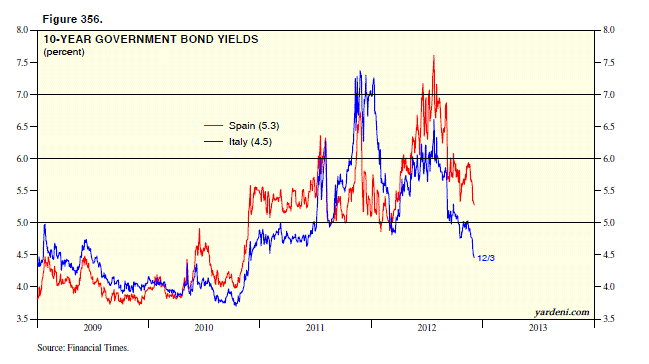
- Greece is qualifying for the next round of aid. This includes writing down debt, a step toward returning to growth. The Euro-bears are in absolute denial about progress, refusing to look at data. Remember how they always cited the 7% rate on the ten-year as the trigger for contagion? How this was going to lead to tumbling dominoes? The rhetoric is still there, but the data are not providing any support. See the chart for Italy and Spain from Dr. Ed:
The Bad
There was some bad news last week, and some of it is important.
- The ECB downgrades the European economic prospects, but keeps policy stable. (Via the FT.) Europe may not represent falling dominoes, but economic stability is at least a year away.
- The ISM Manufacturing index dropped to 49.5. This is contraction in manufacturing, but not necessarily for overall GDP. The ISM cites the GDP break even point as 42.6, and usually provides an implied GDP figure, which I have always cited. It is pretty easy to reverse engineer their regression equation, and I have done so. This month they do not give an implied GDP growth rate. Others have suggested that the relationship has changed over time. For the moment, let us leave it this way: ISM manufacturing below 50 is still consistent with economic growth, probably in the 2% range or so. The ISM attributes weakness to concern over the fiscal cliff. (See here).
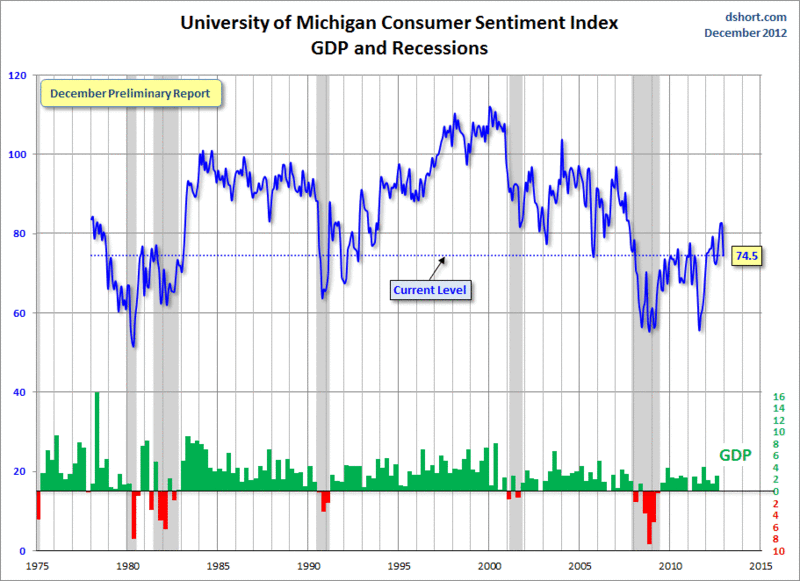
- University of Michigan consumer sentiment plunged to 74.5. In the absence of any other bad news, this has to be attributed to the fiscal cliff and the non-stop media coverage. There is an element of self-fulfilling prophecy to this. Last year's debt ceiling debate did not result in default, but most people only noted the dysfunctional process. Until now, the average person has been willing to wait until after the election for a resolution to issues. This is the first sign of a change -- and it is important. Regular readers know that I love the Doug Short chart of this series, so let us look at the ugly update:
The Ugly
This week's ugly award goes to the worst-run companies of 2012, courtesy of Scott Rothbort. Scott has a passion for education, sharing his knowledge and expertise with Seton Hall students in addition to running his own investment firm. He is a colleague at Wall Street All Stars, where he writes a great daily market column, My Gut Feeling, which draws upon his extensive experience and finger on the pulse of the market. I do not want to slight any other colleagues, because it is a great group. We have a vibrant daily discussion of the market. (Email me if you want a trial or discount to the site).
Scott's choices are based upon sound criteria, and he shows prior membership from 2006. Great fun, and useful!
The Indicator Snapshot
It is important to keep the current news in perspective. My weekly snapshot includes the most important summary indicators:
- The St. Louis Financial Stress Index.
- The key measures from our "Felix" ETF model.
- An updated analysis of recession probability.
The SLFSI reports with a one-week lag. This means that the reported values do not include last week's market action. The SLFSI has moved a lot lower, and is now out of the trigger range of my pre-determined risk alarm. This is an excellent tool for managing risk objectively, and it has suggested the need for more caution. Before implementing this indicator our team did extensive research, discovering a "warning range" that deserves respect. We identified a reading of 1.1 or higher as a place to consider reducing positions.
The SLFSI is not a market-timing tool, since it does not attempt to predict how people will interpret events. It uses data, mostly from credit markets, to reach an objective risk assessment. The biggest profits come from going all-in when risk is high on this indicator, but so do the biggest losses.
The C-Score is a weekly interpretation of the best recession indicator I found, Bob Dieli's "aggregate spread."
Despite the recent media blitz from the ECRI, there is no evidence of an imminent recession concern.
Doug Short has excellent continuing coverage of the ECRI recession prediction, now over a year old. Doug updates all of the official indicators used by the NBER and also has a helpful list of articles about recession forecasting. Doug's latest commentary questions the ECRI definition of sales. He remains open-minded about the upcoming evidence.
For the current time period to be viewed as the start of a recession, we would need to have a significant decline in the economy. Then the NBER goes back and dates the start of the recession at the last peak. As yet we have only small declines, and only in some indicators. We shall see.
RecessionAlert uses a variety of different methods, including the ECRI, in developing a Super Index. They also offer a free sample report. Anyone following them over the last year would have had useful and profitable guidance on the economy. Dwaine Van Vuuren notes that the effects of Sandy have pushed industrial production into recession territory, sending the current chance of a recession over 11% according to one of his indicators. His latest article emphasizes his short-term indicators. He is not identifying a recession in any of the various covered time frames.
Georg Vrba explicitly and carefully refutes the ECRI approach. I encourage a thorough reading of Georg's work -- a few minutes well spent.
Readers might also want to review my new Recession Resource Page, which explains many of the concepts people get wrong. Newly added to the list of errors this week was the popular but bogus 100% recession chart. Amazingly, this is still getting buzz. Confirmation bias in action! 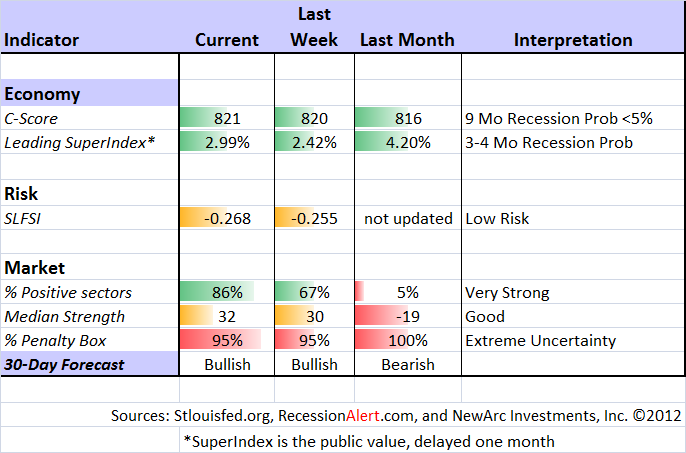
Our "Felix" model is the basis for our "official" vote in the weekly Ticker Sense Blogger Sentiment Poll. We have a long public record for these positions. This week we switched to a bullish position, but the forecast is still cloudy. These are one-month forecasts for the poll, but Felix has a three-week horizon. Felix's ratings stabilized at a low level and improved significantly last week. The penalty box percentage measures our confidence in the forecast. A high rating means that most ETFs are in the penalty box, so we have less confidence in the overall ratings. That measure has moved to the very top of the range. This means that we do not have a lot of confidence in the current bullish rating, nor did we in the former bearish rating. It has been a close call over the last few weeks. "Abstain" might be more accurate.
[For more on the penalty box see this article. For more on the system ratings, you can write to etf at newarc dot com for our free report package or to be added to the (free) weekly ETF email list. You can also write personally to me with questions or comments, and I'll do my best to answer.]
The Week Ahead
This week brings some economic data, but not the most important reports.
The "A List" includes the following:
- The FOMC decision (W) should provide confirmation of additional QE actions.
- Initial jobless claims (Th). Employment will continue as the focal point in evaluating the economy, and this is the most responsive indicator. We will look for confirmation that the Sandy effects are over.
The "B" List" includes these entries:
- Retail sales (Th). One month will not tell the full story, but this is part of the recession analysis.
- Industrial production (F). Same as for retail sales. I expect a pickup here, but the fiscal cliff uncertainty is a factor.
- PPI (Th). Not a factor at the moment.
- CPI (F). Also not a factor.
There will be continuing non-stop speculation, attempting to parse the words of anyone who will discuss the fiscal cliff. None of this will be very helpful. The progress is happening behind the scenes.
Trading Time Frame
Felix has moved to a more bullish posture, but it is not yet reflected in trading accounts. It has been a close call for several weeks. Felix has done very well this year, becoming more aggressive in a timely fashion, near the start of the summer rally, and getting out a couple of months ago. Since we only require three buyable sectors, the trading accounts look for the "bull market somewhere" even when the overall picture is neutral. The ratings have moved much higher in the last two weeks. We are now completely flat in trading accounts, but expect to add positions this week.
Investor Time Frame
Each week I think about the market from the perspective of different participants. The right move often depends upon your time frame and risk tolerance.
I want to emphasize that this is the approach I take for programs with a long-term orientation. It is entirely appropriate for long-term investors to buy when traders are selling. That is often when bargains are found. The smart alec's who call this "dumb money" should spend some time reading the wisdom of Warren Buffett. This is an important time for investors with long-term goals.
Individual investors too frequently try to imitate traders, guessing whether to be "all in" or "all out." This usually leads to mistakes in market timing. There are plenty of stocks at attractive values right now. Here is what to think about:
- Risk. If you are like the average investor you have it all wrong. You have been piling into bonds, gold, and dividend funds. All of these categories are now over-valued, the result of this stampede. Some of the risk is showing up right now, and you will see more in the next few weeks.
- A portfolio anchor. You need stability. If you are trying to do it with bond funds, you need to understand the risks. I prefer owning specific bonds.
- Stretching yield. My approach is to find some reasonable dividend stocks and sell near-term calls against the positions. If you did this skillfully, you could hit double-digit annual returns with significantly less risk than simply owning dividend stocks. The range-bound market of the last few weeks has been ideal for this approach.
- A little octane. Many investors do not think carefully about asset allocation. There is always volatility, so the key is to "right-size" your position. Instead of trying to time the market, try to be a player in the right sectors, the right stocks, and the right size. There are plenty of stocks selling cheaply in terms of their historic P/E multiples.
We have collected some of our recent recommendations in a new investor resource page -- a starting point for the long-term investor. (Comments and suggestions welcome. I am trying to be helpful and I love feedback).
Final Thoughts on the Fed
I expect the Fed to replace "operation twist" with a new asset purchase policy, keeping the monthly target of $85 billion. That is only the start.
This week's FOMC meeting also comes with a press conference from Chairman Bernanke. The Fed's latest initiative, popularly dubbed QE3 or QE infinity, is designed to change market expectations.
It has not worked.
In fact, the Fed Chair's statements have actually fostered the misperceptions listed in the introduction. It is time for clarity instead of Fedspeak:
- The Fed is encouraging businesses to make investments by reducing lending costs. The effect on individual savers is a side effect, not a goal;
- The Fed is interested in asset prices only as an indicator of the economic effectiveness of the policies. The "wealth effect" is also a tertiary mechanism for transmitting policy effects. It would be better to quit mentioning these secondary points. Whenever they are cited, the financial media ignores everything else and pretends that this is the main theme;
- The Fed has expanded the balance sheet, but the money supply has increased at a pace that is lower than the long-term average;
- The Fed's policies take six months or longer to occur. Traders and pundits incorrectly over-estimated the first QE's and are now under-estimating this one.
- The Fed is determined to change expectations, willing to accept more inflation, and geared to much lower unemployment. The individual data releases have little influence.
Since I do not have Bernanke's ear, I am not expecting more clarity. For those who understand Fed policy, this is an opportunity. If you do not wish to fight the Fed, the first step is to understand the policy. How else can you know what you are not fighting??
A Final Thought
The fiscal cliff participants continue to prove in public that they are bargaining hard. It does not matter that Congress took a long weekend. I am still hopeful for a pre-Christmas resolution on the tax issues with overall debt questions coming later. There will be some firm guidelines, but the opportunity for Congress to participate in the details.
The market gyrations will continue, but do not expect meaningful cliff news this week.
