
Like nature, the media abhor a vacuum. There is so much time, and so little valuable content!
That is the best explanation I can offer for the latest media frenzy: The Fiscal Cliff.
It was the big theme on financial television, but also caught the attention of the mainstream news shows as well. This week's Barron's has the recessionary implications of "the cliff" on the cover. CNBC has continued its images of crashing vehicles and also introduced promotional messages and little buttons that all of their anchors wear.
Anyone paying attention has been following this issue for months, understanding that the tense election climate prevented any real progress. The day after the election the stories started, mostly reflecting unrealistic expectations about how quickly Congress goes back to work!
There was also an instant verdict by some, suggesting that since the partisan alignment is about the same, there is no chance for progress.
This chart (via Joe Weisenthal) shows how crazy this has gotten. Check out Joe's article for his helpful take on this subject. 
James A. Kostohryz explains why the "obvious" conclusions are seriously flawed. He provides eight interesting reasons, introduced with the following statement:
In the context of the very understandable pessimism regarding the US's long-term fiscal health, I believe that the real possibilities of a "Grand Bargain" being achieved in the next few weeks / months are perhaps being overlooked. In this regard, it is important to remember that in July of 2011, a Grand Bargain that would have done a great deal to rectify the US's deficit and debt situation was almost reached. I believe that today, while the players may be the same, the historical circumstances are different - and in my view more favorable for achieving a Grand Bargain than they were in July of 2011.
All eight points are worth consideration, as are the author's additional articles describing the possible outlines of a solution.
I'll offer my own take on cliff diving in the conclusion, but first let us do our regular review of last week's news.
Background on "Weighing the Week Ahead"
There are many good lists of upcoming events. One source I especially like is the weekly post from the WSJ's Market Beat blog. There is a nice combination of data, speeches, and earnings reports.
In contrast, I highlight a smaller group of events. My theme is an expert guess about what we will be watching on TV and reading in the mainstream media. It is a focus on what I think is important for my trading and client portfolios.
This is unlike my other articles, where I develop a focused, logical argument with supporting data on a single theme. Here I am simply sharing my conclusions. Sometimes these are topics that I have already written about, and others are on my agenda. I am putting the news in context.
Readers often disagree with my conclusions. Do not be bashful. Join in and comment about what we should expect in the days ahead. This weekly piece emphasizes my opinions about what is really important and how to put the news in context. I have had great success with my approach, but feel free to disagree. That is what makes a market!
Last Week's Data
Each week I break down events into good and bad. Often there is "ugly" and on rare occasion something really good. My working definition of "good" has two components:
- The news is market-friendly. Our personal policy preferences are not relevant for this test. And especially -- no politics.
- It is better than expectations.
The economic news last week was mostly positive. Perhaps it is partly the political season, but there was a little bit of "yes, but" connected to each report.
- Consumer sentiment (via the University of Michigan survey) has finally climbed out of recession territory. I do not use this as a leading indicator, but my research has shown it to be a good concurrent indicator of employment. In recent years it has been affected negatively by high gas prices and last-year's debt ceiling controversy. Since there are continuing effects from those sources, the rebound is encouraging. Doug Short's charts on sentiment do a great job of showing the relationship to the economy as well as the long-term trend.

- Q3 earnings may represent a trough in growth. Earnings guru Brian Gilmartin has been predicting this for some time, and now there is confirmation from the earnings team at Thomson Reuters. Brian also provides a comprehensive review of S&P valuation measures.
- The Chinese economy showed more progress (Bloomberg) both in industrial production (up 9.6%) and inflation (up 1.7%). There was a report from the NYSE floor that some traders were immediately worried that this would mean a reduction in stimulus. This is not a real concern, given the low inflation rate, but it does say something about sentiment.
- Greece voted to approve austerity measures and a new budget. This result was widely expected, despite the headlines about striking workers. It is not a solution, but a step. This has been the story of progress in Europe.
- The election is over! About half of the people are happy with the outcome and the rest are unhappy. Regardless of the outcome, we should all be delighted that there is now hope for dealing with the legislative impasse. Was it a market-unfriendly outcome? Doug Short thinks so, and produces this chart:

Guy Ortman
of Scarsdale Equities, who writes an excellent daily technical commentary, offered a contrary viewpoint in his Thursday note (available only by email):
"...(T)he current dominant media spin suggesting yesterday’s decline was due to the presidential election results is mistaken. Futures were essentially flat around 8:oo am yesterday prior to the disappointing industrial production numbers released by Spain and Germany. It was at that point that futures fell out of bed suggesting European concerns were the cause for the market’s slide, not the re-election of President Obama."
Personally, I was surprised by the pre-election surge on Tuesday. There were many influences. With the market at a key technical level, it does not take much to generate a move. The late-week selling seemed to have much more to do with the non-stop fiscal cliff coverage.
The Bad
The actual data last week was pretty good, but there were some noteworthy negatives.
- Earnings. The earnings "beat rate" has turned weaker as the season nears its end. Expectations were lowered before the season. Bespoke continues to provide helpful coverage and charts nearly every week throughout the season.

- Rail freight traffic is lower, suggesting economic softening. Stephen Hansen has a full report with charts and analysis of the trends.
- The ISM Services Index had a small decline, although the employment component was solid. You can see the trend readily in this chart from Calculated Risk (part of the detailed weekly look at all economic data).

- European economic reports showed further deterioration. The news got an exclamation point from the comments of Mario Draghi, hitting US markets on Wednesday.
The charts. If you are looking at trends, you will find many that seem threatened. You can also find worries about "three domes" and a massive head-and-shoulders.
Since many active traders swear by their charts, we can expect some short-term behavior to follow.
Putting the technical together with the fundamentals, we can see the effect in this chart from Bespoke. (see the full article to get a sector-by-sector breakdown.
The Indicator Snapshot
It is important to keep the current news in perspective. My weekly snapshot includes the most important summary indicators:
- The St. Louis Financial Stress Index.
- The key measures from our "Felix" ETF model.
- An updated analysis of recession probability.
The SLFSI reports with a one-week lag. This means that the reported values do not include last week's market action. The SLFSI has moved a lot lower, and is now out of the trigger range of my pre-determined risk alarm. This is an excellent tool for managing risk objectively, and it has suggested the need for more caution. Before implementing this indicator our team did extensive research, discovering a "warning range" that deserves respect. We identified a reading of 1.1 or higher as a place to consider reducing positions.
The SLFSI is not a market-timing tool, since it does not attempt to predict how people will interpret events. It uses data, mostly from credit markets, to reach an objective risk assessment. The biggest profits come from going all-in when risk is high on this indicator, but so do the biggest losses.
The C-Score is a weekly interpretation of the best recession indicator I found, Bob Dieli's "aggregate spread."
Bob and I recently did some videos explaining the recession history. I am working on a post that will show how to use this method. Bob and I met last week, planning an update soon after the election. As I have written for many months, there is no imminent recession concern. I recently showed the significance of by explaining the relationship to the business cycle.
RecessionAlert uses a variety of different methods, including the ECRI, in developing a Super Index. They also offer a free sample report. Anyone following them over the last year would have had useful and profitable guidance on the economy.
Doug Short has excellent continuing coverage of the ECRI recession prediction, now over a year old. Doug updates all of the official indicators used by the NBER and also has a helpful list of articles about recession forecasting. The most recent news from the ECRI states that they are "Assessing the Current Optimism." This is apparently available only to paid subscribers, the ones who had early access to the 2011 forecast.
Readers might also want to review my new Recession Resource Page, which explains many of the concepts people get wrong. Newly added to the list of errors this week was the popular but bogus 100% recession chart. 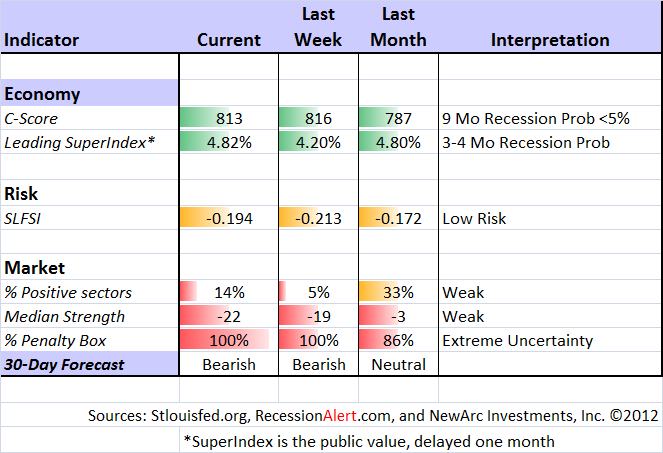
Our "Felix" model is the basis for our "official" vote in the weekly Ticker Sense Blogger Sentiment Poll. We have a long public record for these positions. This week we continued our bearish position. These are one-month forecasts for the poll, but Felix has a three-week horizon. Felix's ratings have continued to drift lower. The penalty box percentage measures our confidence in the forecast. That indicator has moved to the very top of the range. This means that there is so much conflict in the indicators that we do not have a lot of confidence in the current bearish rating. It has been a close call over the last few weeks.
[For more on the penalty box see this article. For more on the system ratings, you can write to etf at newarc dot com for our free report package or to be added to the (free) weekly ETF email list. You can also write personally to me with questions or comments, and I'll do my best to answer.]
The Week Ahead
This week brings more economic data, but not the most important reports.
The "A List" includes the following:
- Initial jobless claims (Th). Employment will continue as the focal point in evaluating the economy, and this is the most responsive indicator. Possible Sandy effects.
- Industrial production (F). This has continuing significance for GDP.
The "B" List" includes these entries:
- PPI (W) and CPI (Th). Someday these reports will matter more.
- FOMC minutes (W). Perhaps a little more color on the QE3 thinking.
- Retail sales (W). Difficult to interpret because of Superstorm Sandy.
There will be more news about Greece and progress toward the next funding gap.The regional Fed surveys might surprise.
There will be continuing non-stop speculation, attempting to parse the words of anyone who will discuss the fiscal cliff.
Trading Time Frame
Felix has continued in a marginally bearish posture. It has been a close call for several weeks. Felix has done very well this year, becoming more aggressive in a timely fashion, near the start of the summer rally. Since we only require three buyable sectors, the trading accounts look for the "bull market somewhere" even when the overall picture is neutral. The ratings have moved lower again this week. We are 1/3 invested in an inverse ETF for trading accounts, and another 1/3 would not be surprising.
Investor Time Frame
Each week I think about the market from the perspective of different participants. The right move often depends upon your time frame and risk tolerance. Individual investors too frequently try to imitate traders, guessing whether to be "all in" or "all out."
Investors often let the calendar tell them when to review, but sometimes events provide a better guide. There is a lot of opportunity right now. Here is what to think about:
- Risk. If you are like the average investor you have it all wrong. You have been piling into bonds, gold, and dividend funds. All of these categories are now over-valued, the result of this stampede.
- A portfolio anchor. You need stability. If you are trying to do it with bond funds, you need to understand the risks. I prefer owning specific bonds.
- Stretching yield. My approach is to find some reasonable dividend stocks and sell near-term calls against the positions. If you did this skillfully, you could hit double-digit annual returns with significantly less risk than simply owning dividend stocks.
- A little octane. Many investors do not think carefully about asset allocation. There is always volatility, so the key is to "right-size" your position. Instead of trying to time the market, try to be a player in the right sectors, the right stocks, and the right size. There are plenty of stocks selling cheaply in terms of their historic P/E multiples.
We have collected some of our recent recommendations in a new investor resource page -- a starting point for the long-term investor. (Comments and suggestions welcome. I am trying to be helpful and I love feedback. We have a good discussion going on bonds versus funds, and I plan a separate article that will provide a further forum.)
Final Thoughts on Cliff Diving
I can state this pretty simply: A dive over the fiscal cliff will not happen. There are specific and personal tax and budget consequences for nearly everyone -- especially major GOP constituencies like those who will get hit with the Alternative Minimum Tax and business leaders who need to plan. Most people seem not to realize how close the two parties are to a reasonable compromise. I first expect a temporary plan that will address some problems and buy time, but I would not be surprised to see specifics sooner than most expect.
The simplistic comparisons to 2011 have many flaws, and the comparisons to TARP in 2008 are even worse. I have been planning to write more about the probable outcome of the tax and budget negotiations. This is best done when the topic is relevant and we have a little more useful information.
Meanwhile, what we have right now is a little bit of preliminary posturing. Imagine that you were about to represent your team of investors (or workers or business leaders) in important negotiations. Would you start the process with a public declaration of your best and final offer?
There is no information in this posturing, but you can expect to hear all sorts of wild statements. These provide a negotiating position and set the stage for compromise. Meanwhile, the stock market rallies on one sentence from the President or the Speaker, and then sells off on the next. Most of the predictions you see come from those who no experience or track record in forecasting public policy outcomes. They also seem to have forgotten that the election is over, providing a window of opportunity for joint action before the battle resumes.