This week’s economic calendar is pretty light. Market participants will be looking to an early getaway for the long weekend. While there will be plenty of entertaining FedSpeak, I expect a different topic to be at the fore. Pundits will be asking:
Should investors react to the oil price rally?
Last Week
The news was pretty good, but the stock market was not.
Theme Recap
In my last WTWA, I predicted that the punditry would be asking whether it was “springtime for housing”. That was the recurring topic as housing news was reported on several different days and garnered plenty of discussion. Competition came from the Fed Minutes, some dramatic earnings reports, and the election race.
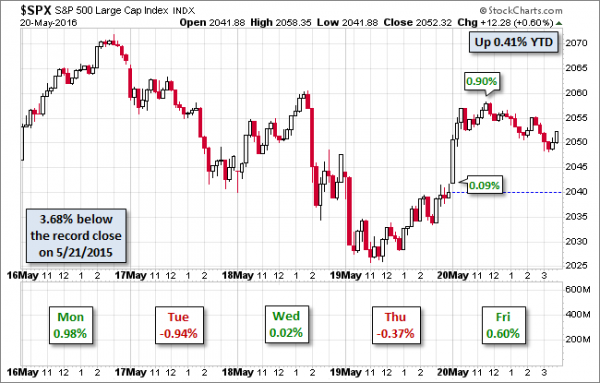
The Story in One Chart
I always start my personal review of the week by looking at this great chart of the S&P 500 from Doug Short. He has a special knack for pulling together all of the relevant information. His charts save more than a thousand words! Read his entire post where he adds analysis and several other charts providing long-term perspective.
The News
Each week I break down events into good and bad. Often there is an “ugly” and on rare occasion something really good. My working definition of “good” has two components. The news must be market friendly and better than expectations. I avoid using my personal preferences in evaluating news – and you should, too!
The economic and market news, on balance, was pretty good.
The Good
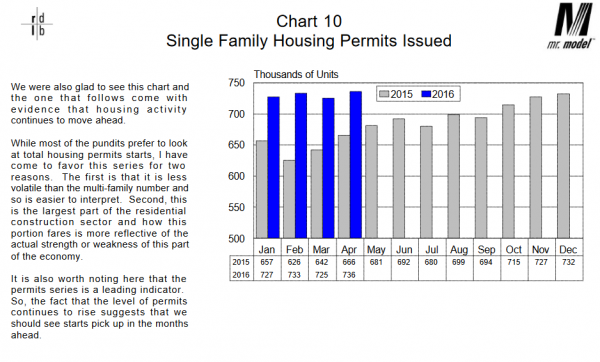
- Housing starts increased to a 1.172 annual rate, beating expectations. Calculated Risk has a complete analysis. I am especially interested in single-family building permits, a good leading indicator. Bob Dieli’s monthly economic report always updates this chart:
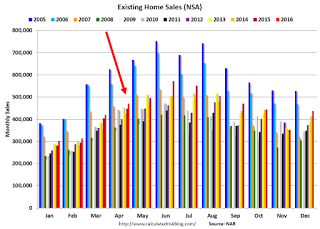
- Existing home sales were up 5.45 million (SAAR), the top of the Calculated Risk range for a solid report. Bill writes:
Note that January and February are usually the slowest months of the year and March and April are the beginning of the “selling season”. This is a solid start to the year.
- Jobless claims down ticked to 278K, in line with estimates and below the 300K level that some have been citing. (The four-week moving average was up slightly).
- Industrial production rose by 0.7%. Eddy Elfenbein has a good report, noting that this interrupts the downtrend since November, 2014. He also points out the effect on the Atlanta Fed’s GDP forecast for Q2, now up to 2.8%
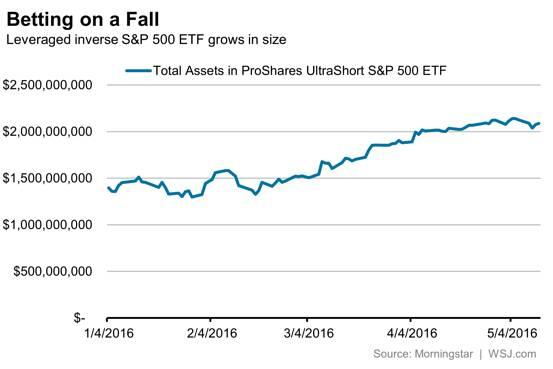
- Sentiment remains very negative. Urban Carmel summarizes asset allocations and economic skepticism. Ben Eisen of the WSJ cites four stats, including the fund flows in the chart below. Schwab’s Liz Ann Sonders agrees. She notes only negative questions from both investors and advisors, “all almost bordering on Armageddon.”
The Bad
- The Philly Fed index remained negative and essentially unchanged, -1.8 on the diffusion index. Employment improved dramatically, but remained marginally negative. The outlook fell a bit but remained strongly positive. There was little market reaction.
- Fed minutes showed more chance for a June rate increase. Our go-to Fed expert, Tim Duy, sees a June hike as a bit less than 50-50 but July as quite possible. The Fed remains more confident about the economy than most market participants.
- LA port traffic declined. Calculated Risk uses a rolling twelve-month average to control for seasonality. The decline was 0.7% for inbound traffic and 0.8% for outbound. Steven Hansen opines that this raises recession concerns.
- Rail traffic “moves deeper into contraction”. Steven Hansen looks at a variety of rolling averages, including some analysis that adjusts for the declining coal shipments.
The Ugly
State and local pension funds. Chicago provides an example. A decision of the Illinois Supreme Court struck down an “overhaul” of the system, adding $11.5 billion to the deficit, now $18.6 billion. The fund covers 70,000 workers and in the absence of any changes, will run out of money in ten years. (Crain’s Chicago Business)
Noteworthy
Try this financial literacy quiz designed by economists from Wharton and George Washington. (via Shawn Langlois) I am confident that WTWA readers will do well. Keep in mind that less than 1/3 of the population could get all three questions right!
The Silver Bullet
I occasionally give the Silver Bullet award to someone who takes up an unpopular or thankless cause, doing the real work to demonstrate the facts. Think of The Lone Ranger. This week’s award goes jointly to Gene Epstein of Barron’s and New Deal Democrat of the Bonddad Blog and xe.com. Both take on the frequent current scary articles about the “flattening” yield curve, citing the yield difference between the ten-year and two year notes. That spread is currently 0.94 percentage points. Those on a mission often cherry-pick the part of the curve to analyze, and cry alarm whenever it gets a little smaller.
Epstein points out that until the curve actually inverts (a spread of less than zero) there is not a reliable recession indicator.
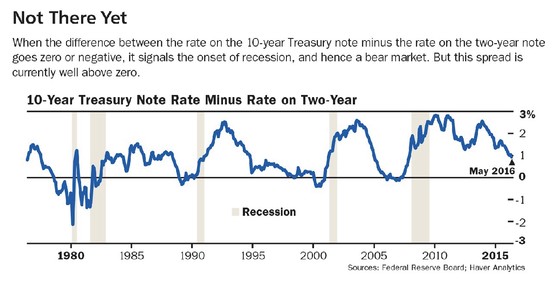
NDD has a great article with plenty of charts. He calls out the “doomers” with this commentary and chart:
In the last week or so there have been a spate of articles – from the usual Doomer sources but also from some semi-respectable sites like Business Insider vans an investment adviser or two, see here – to the effect that the yield curve is flattening and OMG RECESSION!!! Here’s a typical Doomer graph – that draws a trend line that ignores the 1970s and neglects to mention that 2 of the 4 inversions even within the time specified don’t fit:
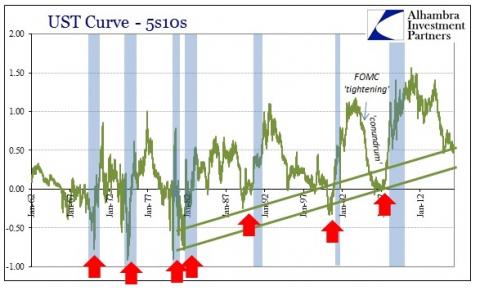
I wish that more publications would recognize the Silver Bullet winners and writers like them. It is difficult to call out weak and biased posts. There is little reward for good and courageous analysis.
The Week Ahead
We would all like to know the direction of the market in advance. Good luck with that! Second best is planning what to look for and how to react. That is the purpose of considering possible themes for the week ahead. You can make your own predictions in the comments.
The Calendar
We have a modest week for economic data. I highlight the most important items, helping us all to focus.
The “A” List
- New home sales (T). Continuing strength in housing?
- Durable goods (Th). Important April data. Continuing recent strength?
- Initial claims (Th). The best concurrent indicator for employment trends.
- Michigan sentiment (F). Best for job growth and prospective spending. Strength continuing?
The “B” List
- Pending home sales (Th). Unlikely to match last month. Not as important as new sales, but a read on the market.
- GDP second estimate for Q1 (F). This will get attention, but it is old news by now with Q2 more than half over.
- Crude inventories (W). Often has a significant impact on oil markets, a focal point for traders of everything.
There is plenty of FedSpeak, including a Friday appearance by Chair Yellen. Things will be slowing down by Friday as some slip away early for a long weekend marking the unofficial start of summer.
Next Week’s Theme
It is a pretty light economic calendar. In addition to the daily dose of analysis by pseudo-experts on the Fed, I expect to see some serious discussion about energy prices.
Will the oil rally continue? What does that imply for investors and traders?
Voting a tentative “No” is Dana Lyons, who cites technical resistance and concludes as follows:
Will the oil rally stop here? We have no idea – but we wouldn’t be surprised to see the rally get clogged up, at least temporarily.
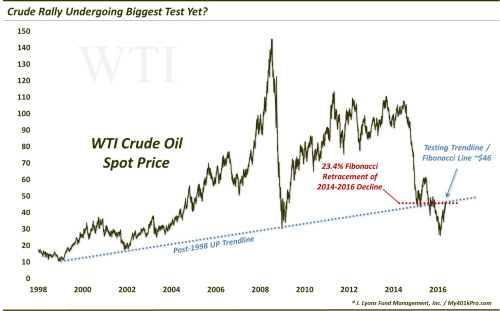
Oil & Energy Insider is also cautious but more bullish, mostly citing fundamentals. Their free edition includes this analysis:
Oil prices bounced around this week, flirting with $50 per barrel but stopping short of that key threshold. The major supply outages in Nigeria (now at 900,000 barrels per day) and Canada (more than 1 million barrels per day) continue to put upward pressure on oil prices as they are erasing the supply overhang. Still, much of that will be temporary. The EIA poured a bit of cold water on the rally this week, reporting a surprise uptick in oil stocks. At the same time, U.S. production continues to slowly erode. The markets are more confident than at any point in recent weeks that prices won’t crash back into the $30s, but more movement to the upside is not a given.
Their premium edition (which requires a subscription) is headlined Fundamentals Starting to Underpin Oil Price Rally. They cover a wide range of considerations, but include key questions: When might we expect Nigerian supply to rebound? Most investors would find their analysis quite helpful:
– The Niger Delta Avengers have attacked pipelines and platforms in Nigeria, knocking 800,000 barrels per day offline.
– Between 2006 and 2009 Nigeria suffered a similar level of attacks and outages, and a sweeping amnesty policy helped bring an end to the violence. The new President Muhammadu Buhari has taken a tougher line, ending patronage that existed in security contracts for many militia members, a move that has contributed to the resurgence in pipeline attacks.
– Nigeria’s cash reserves are running low as its economy slows. Reserves have plunged from $49 billion in 2013 to $27 billion recently.
– Eni (NYSE:E) suffered the latest attack this week. Fellow oil majors Royal Dutch Shell (NYSE:RDSa) and Chevron (NYSE:CVX) have also seen their infrastructure taken out from explosions.
– Nigeria’s oil production is at its lowest level since the 1980s. The attacks show no sign of letting up, and as of now the Nigerian government is unwilling to back down.
Quant Corner
We follow some regular great sources and also the best insights from each week.
Risk Analysis
Whether you are a trader or an investor, you need to understand risk. Risk first, rewards second. I monitor many quantitative reports and highlight the best methods in this weekly update.
The Indicator Snapshot
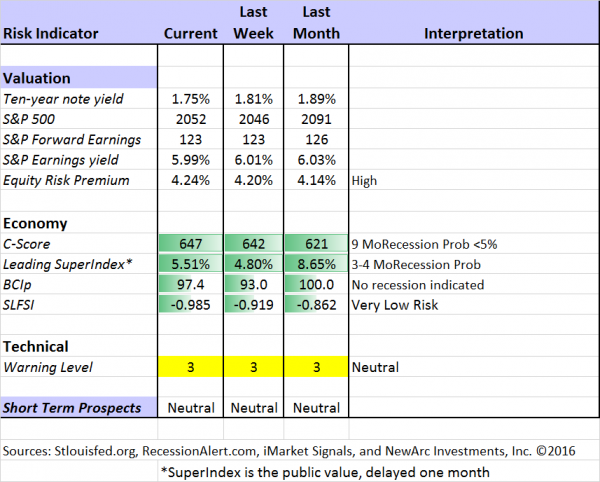
The Featured Sources:
Doug Short: The Big Four Update, the World Markets Weekend Update (and much more).
Brian Gilmartin: Analysis of expected earnings for the overall market as well as coverage of many individual companies. This week he observes that more people are using forward earnings, and many are thinking about 2017.
Bob Dieli: The “C Score” which is a weekly estimate of his Enhanced Aggregate Spread (the most accurate real-time recession forecasting method over the last few decades). Monthly reports including both an economic overview the economy and employment.
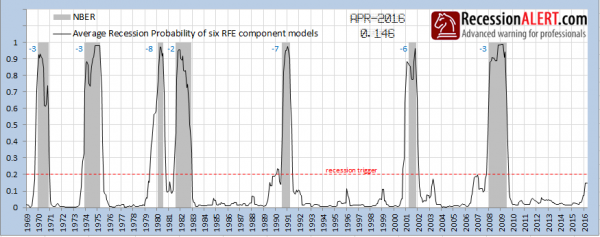
RecessionAlert: Many strong quantitative indicators for both economic and market analysis. While we feature the recession analysis, Dwaine also has a number of interesting approaches to asset allocation. This week Dwaine opened to the public one of his subscriber-only research reports. He notes that one of his recession indicators has moved up to 60%. He goes on to explain that he uses a group of six different methods as his preferred approach. He writes as follows:
Another way to look at the RFE is to average the current recession probability showing on each of its six model components, which is currently showing a 14.6% probability of recession. This model appears to have served well in the past, with zero false positives above readings of 0.20.
Georg Vrba: The Business Cycle Indicator, and much more. Check out his site for an array of interesting methods.
Holmes: Our cautious and clever watchdog, who sniffs out opportunity like a great detective, but emphasizes guarding assets.
Noteworthy this week:
Hedge funds are using artificial intelligence to analyze the Fed minutes. Guess who can do it faster – you or them?
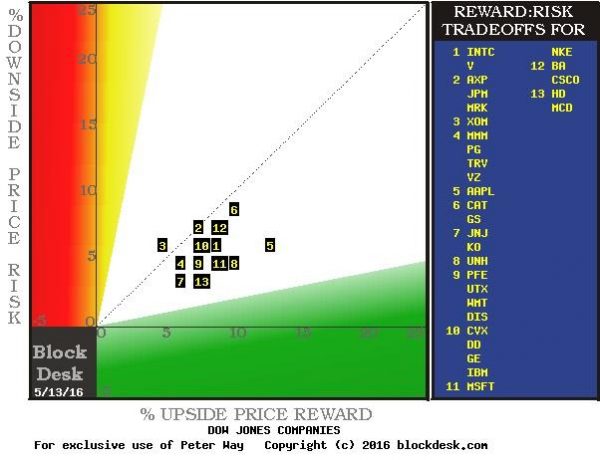
Peter F. Way reports on the hedging techniques of “big money” traders, identifying candidates with the best risk/reward balance. Apple?
How to Use WTWA
In this series I share my preparation for the coming week. I write each post as if I were speaking directly to one of my clients. For most readers, they can just “listen in.” If you are unhappy with your current investment approach, we will be happy to talk with you. I start with a specific assessment of your personal situation. There is no rush and no cookie-cutter approach. Each client is different, so I have six different programs ranging from very conservative bond ladders to very aggressive trading programs. A key question:
Are you preserving wealth, or like most of us, do you need to create more wealth?
My objective is to help all readers, so I provide a number of free resources. Just write to info at newarc dot com. We will send whatever you request. We never share your email address with others, and send only what you seek. (Like you, we hate spam!) Free reports include the following:
- Understanding Risk – what we all should know.
- Income investing – better yield than the standard dividend portfolio.
- Felix and Holmes – top artificial intelligence techniques in action.
- Why 2016 – The Year of the Value Stocks – finding cheap stocks based on long-term earnings.
You can also check out my website for Tips for Individual Investors, and a discussion of the biggest market fears. (Suggestions and questions welcome!)
Best Advice for the Week Ahead
The right move often depends on your time horizon. Are you a trader or an investor?
Insight for Traders
We consider both our models and also the best advice from sources we follow.
Felix and Holmes
We continue our neutral market forecast. Felix is about 75% invested, and with less aggressive sectors. REITs and utilities have moved near the top of the list. The (usually) more cautious Holmes remains almost fully invested. Holmes uses a universe of nearly 1000 stocks, selected mostly by liquidity. Even when the overall market is neutral, there will often be some strong candidates.
Top Trading Advice
Dr. Brett Steenbarger has important advice about Seeing Beneath the Market Surface. He writes:
Markets move higher, markets move lower. The question worth continually posing is, “Is the market getting stronger or weaker?” This is a meaningful question because a market that moves higher can be getting weaker and a market that moves lower can be getting stronger.
Read the entire post as he explains how to apply this approach.
Insight for Investors
Investors have a longer time horizon. The best moves frequently involve taking advantage of trading volatility!
Best of the Week
If I had to pick a single most important source for investors to read, it would be this Forbes article by Brett Steenbarger (and not just because he has some kind words about WTWA, but thanks!) As a psychologist and trading coach he sees things missed by others and explains them very well. I share many of his themes, but often cannot communicate them as well. People need to be open to new ideas and unemotional in executing the plan.
Few can meet these tests.
Stock Ideas
Chuck Carnevale has a timely post on cyclical stocks. He shows how to use his tools to analyze valuation in this difficult sector. When can these stocks be right for dividend-oriented, conservative investors? Emerson Electric (NYSE:EMR) is his illustration. If you agree with our experts that a recession is not imminent, cyclical stocks are a good place to shop.
How about Kroger (NYSE:KR)? Hale Stewart makes this a good example of how to search for a good stock – find an interesting sector, a cheap stock, and a catalyst.
Retailers that might profit from the “Amazon (NASDAQ:AMZN) effect.” (Philip Van Doorn) Hint: they need to change their business model.
Marc Gerstein has some interesting contrarian retail plays. Marc always uses some science in his method. Here he identifies desired characteristics, develops a screen, and looks for a catalyst. It is another article that goes beyond simply delivering stock ideas (although it does that). Stock screening meets Peter Lynch.
How about solar? If energy prices improve, solar stocks do as well. Travis Hoium has an interesting argument favoring First Solar (NASDAQ:FSLR) over some alternatives.
Outlook
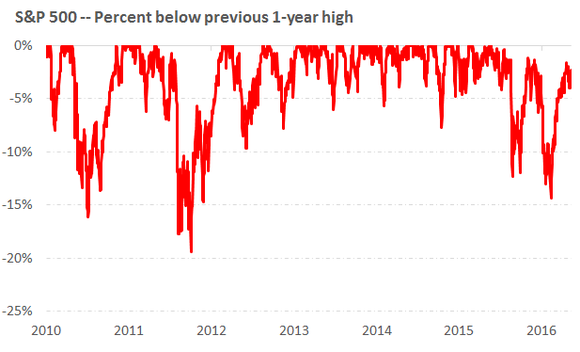
Why is it so attractive to be negative on your investments? One good answer lies in Morgan Housel’s explanation of volatility and how it can take investors off course. It is so easy to think about an account in terms of how far we are from the past high. In fact, that is the condition over 87% of the time. Each year includes a lot of big moves that seem small when you later look at the long-term stock chart. He uses 1998 as a year of major gains, but only if you were able to ride out the major swings. I like this chart showing time spend below the prior high:
Personal Finance
Professional investors and traders have been making Abnormal Returns a daily stop for over ten years. The average investor should make time (even if not able to read AR every day as I do) for a weekly trip on Wednesday. Tadas always has first-rate links for investors in this special edition. There are always several great choices worth reading, but my favorite this week is from Carl Richards at Investment News. He suggests that a good financial advisor helps clients by turning off the news spigot. (If you do not use a financial advisor, I recommend that you turn it off anyway! You might make an exception for WTWA).
There’s a valuable role for us to play as real financial advisers, that of the human curator. Do our clients really need to spend hours sorting through their feeds and trying to decode the headlines or could we be doing that for them? What should they be paying attention to?
For instance, one friend shared with me that when he turned off the financial news spigot, he calculated that he saved two to three hours every night. Do the math and it ends up being a savings of 40 or so days each year.
Value Stocks
Time to buy again? They are cheaper than the broad market and that seemed to be the story last week.
Watch out for….
Boeing (NYSE:BA). Barron’s warns that demand for fuel-efficient aircraft has declined.
Bonds and fund redemptions. If the ten-year note increases one percentage point, to something like 2.8%, you will immediately lose 9% on your investment. It would take a few years to make that up, even if rates moved no higher.
Investment big-shots using a platform to talk their book. Are they really there to help you? This is an interesting summary of recommendations at the recent SALT conference, which was breathlessly covered in the media. Most of the topics would require a lot of research, but the Sherwin-Williams (NYSE:SHW) recommendation (You can’t buy paint online) caught my attention. It took about five seconds to discover the error of this assertion.
13F filings. Here is one example that highlights stocks from David Einhorn. This, and nearly everything written about 13F reports is misleading. This WSJ article headlining George Soros is especially misleading. I explained this carefully (for the second time) but no one cares. We can think of it as our secret!
Final Thoughts
Knowing economics helps to understand energy pricing, but the payoff for that knowledge has been delayed. In my most popular article ever on Seeking Alpha, I noted a few basic facts about energy including the relatively small gap between supply and demand. We are now observing the closing of that gap. It could (and will) continue in one of three ways:
- Reductions in supply through economic forces. U.S. producers responded, but most others have not – so far at least.
- Increases in demand through a growing economy. This is happening with record miles driven in the U.S. and many new consumers worldwide.
- External shocks, through weather, disasters, or war.
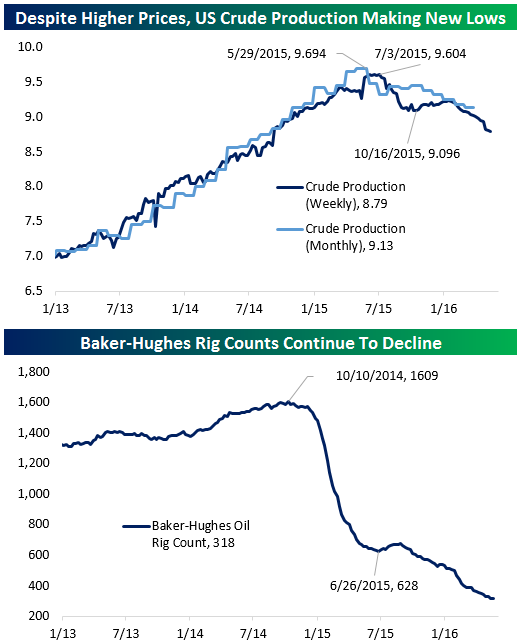
The same economic effects may well push against a price increase. The reduction in rig counts, for example, seems to have paused for the first time in eight weeks. Bespoke has one of their great charts using data from the primary source on drilling activity, the Baker-Hughes weekly report.
Even if $50/barrel represents an intermediate high for oil prices there are important favorable consequences:
- The savings to the consumer, compared to recent years, remains large;
- The fears about failing companies and job losses, exaggerated and localized, will be less of a story.;
- The concern about banks failing due to oil company bankruptcies will be reduced.
Current oil prices may represent a sweet spot both for the energy sector and the overall stock market.
