The data calendar continues in something of an alternating mode. This week we have a concentration of the important economic releases. We also have daily appearances by Fed members. This provides a daily opportunity for pundits to interpret the news:
Can markets finally celebrate good news?
Prior Theme Recap
In my last WTWA I predicted special attention to housing sector issues in a week without much other data. Instead, the Brussels attacks quickly dominated the news. When there was not much additional information, the stories featured the reactions of one and all. Doug Short notes the S&P 500's three-day losing streak in his excellent weekly chart. (With the ever-increasing effects from foreign markets, you should also add Doug’s World Markets Weekend Update to your reading list).
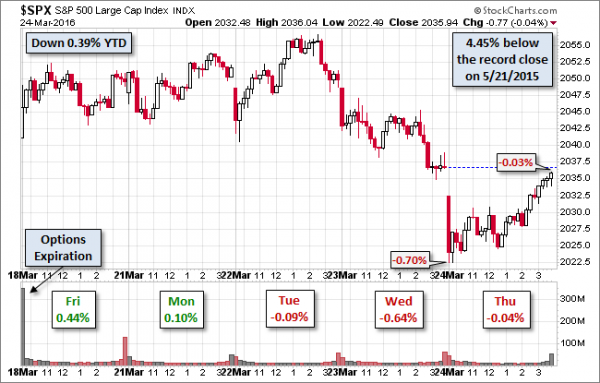
Doug’s update also provides multi-year context. See his full post for more excellent charts and analysis.
We would all like to know the direction of the market in advance. Good luck with that! Second best is planning what to look for and how to react. That is the purpose of considering possible themes for the week ahead. You can make your own predictions in the comments.
This Week’s Theme
The economic calendar includes all of the most important reports. Fed participants will be out in force. There will be plenty of fresh news to ponder.
In theory, the avalanche of news could lead to a dramatic market move. In practice, it usually works differently. The economic data are mixed. The Fed speakers disagree. Pundits are free to interpret the evidence through the prism of their predispositions. The difference in these viewpoints leads me to conclude that many will be asking:
Will good news be good for stocks?
And of course, the corollary – will bad economic news get a cushion from expectations of slower Fed tightening?
Viewpoints
The basic themes are familiar.
- Good news about the economy is good for stocks;
- The Fed will react to offset economic news either way – keeping the trading range; or
- Nothing matters except oil prices.
Challenge
Your conclusion about how stocks will react is a function of what you believe is driving current market action. We do not get paid for knowing yesterday’s news, but it is important to understand the sources of market reaction.
Suppose at the start of last week, people could go “back to the future” and know about the Brussels attacks. What do you suppose would have been their market forecast? In actuality, when everyone knew the answer, we heard many explanations that events like this were now accepted as normal risks. I do not like the very idea that such events are “normal.” I understand the theoretical concept that the market significance is small. With that in mind, my point is how much easier it is to make statements like this after the fact.
Let’s try next week instead. Suppose the market has a significant rally. Many will say that it was end-of-quarter window dressing. But we all know the quarter is ending. If you expect a window-dressing rally, say it now – not as some know-it-all explanation next weekend. If the market declines, I suppose it will be called “profit taking.”
As always, I have my own opinion in the conclusion. But first, let us do our regular update of the last week’s news and data. Readers, especially those new to this series, will benefit from reading the background information.
Last Week’s Data
Each week I break down events into good and bad. Often there is an “ugly” and on rare occasion something really good. My working definition of “good” has two components:
- The news is market-friendly. Our personal policy preferences are not relevant for this test. And especially – no politics.
- It is better than expectations.
The Good
There was some good news in a light week for data.
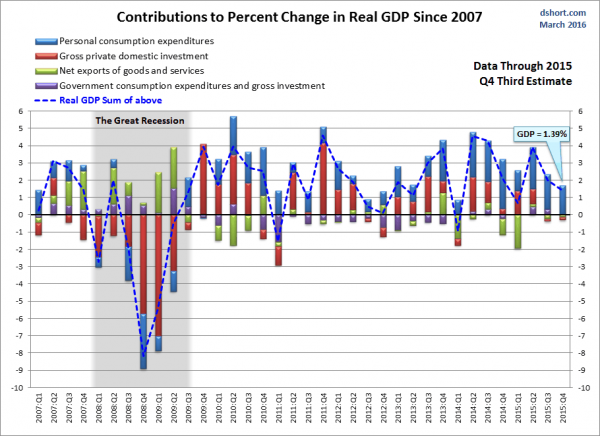
- Q4 GDP was up 1.4% up from the 1.0% in the last report. Consumers were the big reason (Eddy Elfenbein). Doug Short’s well-designed bar chart illustrates this point.
- Market liquidity is much better than people think. (Matt Turner at BI).
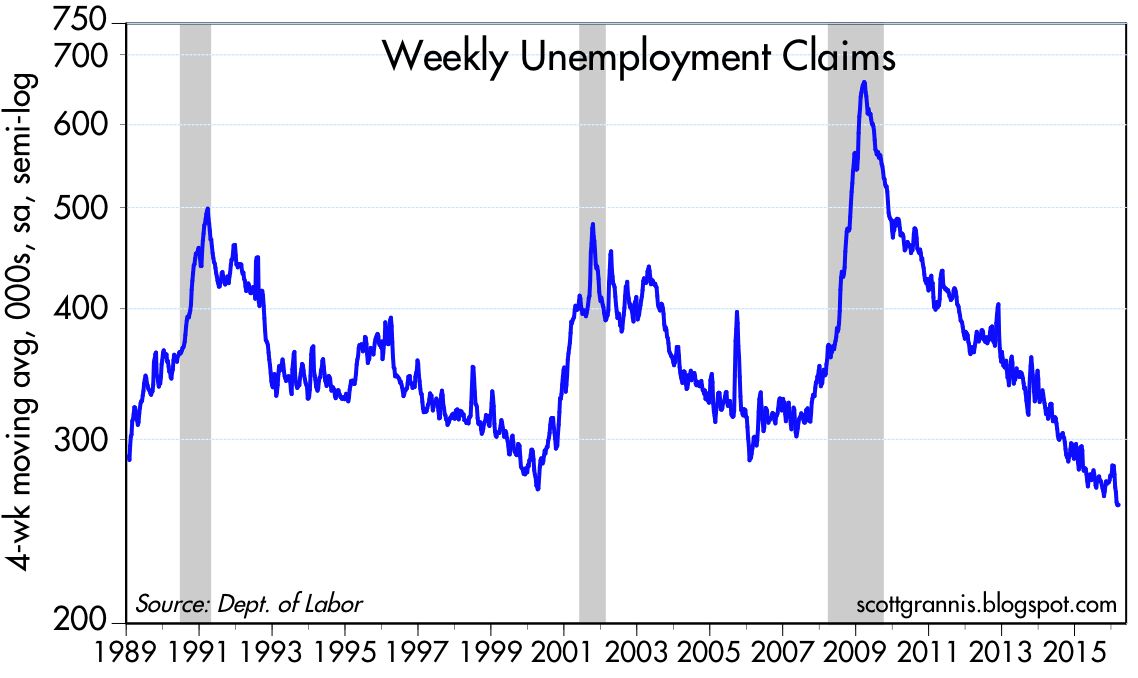
- Initial jobless claims of 265K remained very low. (Scott Grannis)
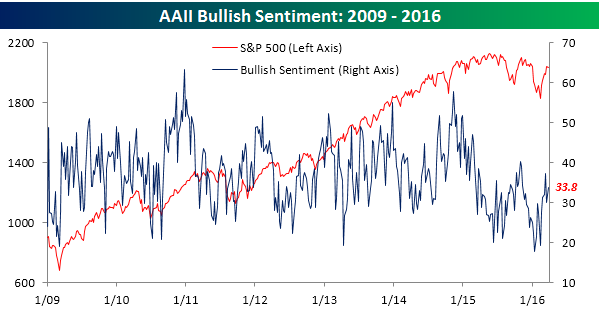
- Sentiment is still not bullish, despite the recent rally. This is a positive on a contrarian basis. Bespoke has the story.
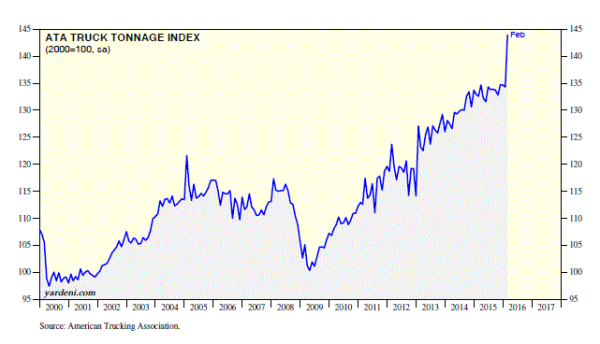
- Trucking tonnage is strong. Dr. Ed reviews the rebound in several recent economic indicators, including trucking.
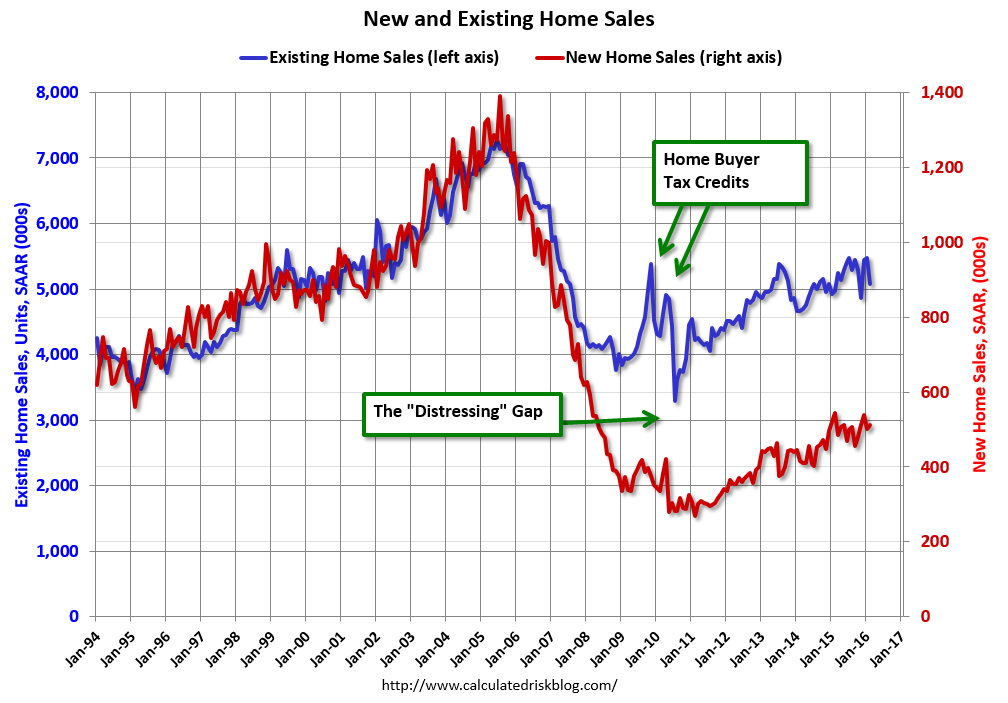
- New home sales increased at a seasonally adjusted annual rate of 512K. This was slightly better than expectations, and has more economic significance than existing sales. Calculated Risk once again notes the “distressing gap” between existing and new sales. The two series tracked closely until the housing bubble and bust. Bill observes that the gap is narrowing and expects the trend to continue.
The Bad
Some of the news was negative.
- Durable goods orders declined by 2.8%,
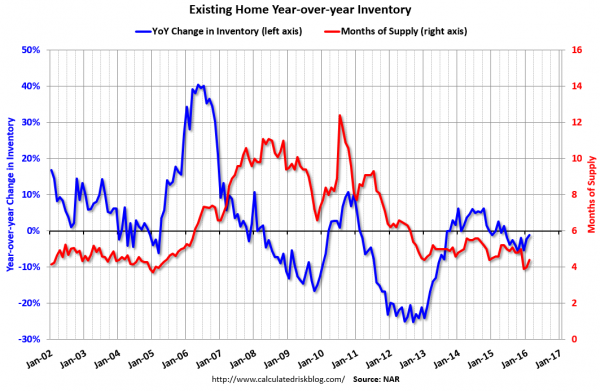
- Existing home sales declined 7.1% month-over-month with a seasonally adjusted annual rate of 5.08 million. Calculated Risk cites low inventory and stress in oil patch regions as contributing factors. The chart below shows the changes in months of supply.
Truth or Fake?
We know that truth can be stranger than fiction. Many probably know the real answers to these questions, but please play along.
- A major company unleashes a tweeting robot. It swiftly becomes offensive and bigoted. (Does that mean that it passed or failed the Turing test?) The FT’s Izabella Kaminska has an imaginative and interesting take – a Trading Places-style bet?
- Petitioners demand open carry of firearms at the Republican National Convention. (Akron Beacon Journal) The fact of the petition is known. The source and motive is not – at least in theory. Readers and clients who are Second Amendment fans please not that I am raising a point about media coverage. You may decide for yourself on the merits of the petition!
- The research team at a major mutual fund is on a mission to create self-serving results. This is one of my occasional attempts at humor. Those who read it joined Mrs. OldProf in a laugh. Maybe you will, too. She also liked “The Rookie” who showed both knowledge and integrity. Maybe I’ll bring the character back.
The Silver Bullet
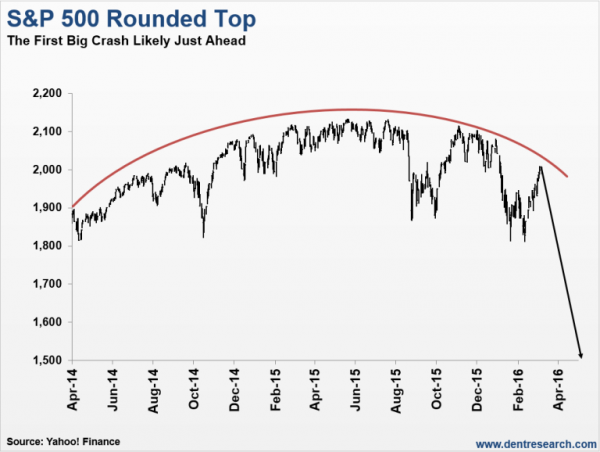
I occasionally give the Silver Bullet award to someone who takes up an unpopular or thankless cause, doing the real work to demonstrate the facts. Think of The Lone Ranger. Often the winner has done a single refutation of a specific post. Sometimes that is not enough to make the point. No single statement has enough substance to disprove! To appreciate Jacob Wolinsky’s effort you really need to read the entire article. The subject is Harry Dent, who provides the chart below — and a product to save you from the result!
Quant Corner
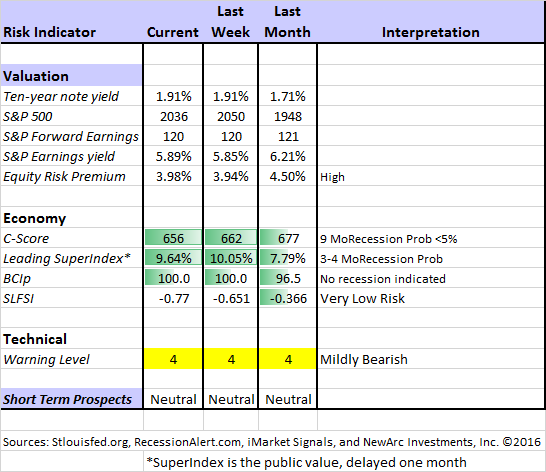
Whether a trader or an investor, you need to understand risk. I monitor many quantitative reports and highlight the best methods in this weekly update. Beginning last week I made some changes in our regular table, separating three different ways of considering risk. For valuation I report the equity risk premium. This is the difference between what we expect stocks to earn in the next twelve months and the return from the 10-Year Treasury note. I have found this approach to be an effective method for measuring market perception of stock risk. This is now easier to monitor because of the excellent work of Brian Gilmartin, whose analysis of the Thomson-Reuters data is our principal source for forward earnings.
Our economic risk indicators have not changed.
In our monitoring of market technical risk, I am now using our new model, “Holmes”. Holmes is a friendly watchdog in the same tradition as Oscar and Felix, but with a stronger emphasis on asset protection. We have found that the overall market indication is very helpful for those investing or trading individual stocks. The score ranges from 1 to 5, with 5 representing a high warning level. The 2-4 range is acceptable for stock trading, with various levels of caution.
The new approach improves trading results by taking some profits during good times and getting out of the market when technical risk is high. This is not market timing as we normally think of it. It is not an effort to pick tops and bottoms and it does not go short.
Interested readers can get the program description as part of our new package of free reports, including information on risk control and value investing. (Send requests to info at newarc dot com).
In my continuing effort to provide an effective investor summary of the most important economic data I have added Georg Vrba’s Business Cycle Index, which we have frequently cited in this space. In contrast to the ECRI “black box” approach, Georg provides a full description of the model and the components.
For more information on each source, check here.
Recent Expert Commentary on Recession Odds and Market Trends
Bob Dieli does a monthly update (subscription required) after the employment report and also a monthly overview analysis. He follows many concurrent indicators to supplement our featured “C Score.”
Georg Vrba: provides an array of interesting systems. Check out his site for the full story. We especially like his unemployment rate recession indicator, confirming that there is no recession signal. He gets a similar result with the twenty-week forward look from the Business Cycle Indicator, updated weekly and now part of our featured indicators.
Doug Short: Provides an array of important economic updates including the best charts around. One of these is monitoring the ECRI’s business cycle analysis, as his associate Jill Mislinski does in this week’s update. His Big Four update is the single best visual update of the indicators used in official recession dating. You can see each element and the aggregate, along with a table of the data. The full article is loaded with charts and analysis.
RecessionAlert: A variety of strong quantitative indicators for both economic and market analysis. While we feature the recession analysis, Dwaine also has a number of interesting systems. These include approaches helpful in both economic and market timing. He has been very accurate in helping people to stay on the right side of the market.
The Week Ahead
We have a huge week for economic data. While I highlight the most important items, you can get an excellent comprehensive listing at Investing.com. You can filter for country, type of report, and other factors.
The “A List” includes the following:
- Employment report (F). Despite wide error band and revisions, still most important.
- ISM index (F). Good for overall economy as well – some leading quality.
- Consumer confidence (T). Conference Board version good for employment and spending.
- Michigan sentiment (F). Same as Conference Board, but uses the “panel” approach.
- Auto sales (F). One of the most important elements of the recovery – private data.
- ADP private employment (W). Strong independent measure of employment.
- Personal income and spending (M). One of the most important indicators.
- Initial Claims (Th). The best concurrent news on employment trends.
The “B List” includes the following:
- PCE price (M). The Fed’s favorite inflation indicator deserves attention.
- Construction spending (F). Volatile February data, but important.
- Pending home sales (M). Less important than new construction, but worth watching.
- Chicago PMI (Th). One of two regional measures worth watching.
- Crude oil inventories (W). Attracting a lot more attention these days.
There is an abundance of FedSpeak! And just when so many think that so much transparency and multiple voices are a problem. Personally, I find it helpful to look at individual positions, just as we would with other democratic institutions that vote, but many seem to prefer less information.
How to Use the Weekly Data Updates
In the WTWA series I try to share what I am thinking as I prepare for the coming week. I write each post as if I were speaking directly to one of my clients. Each client is different, so I have six different programs ranging from very conservative bond ladders to very aggressive trading programs. It is not a “one size fits all” approach.
To get the maximum benefit from my updates you need to have a self-assessment of your objectives. Are you most interested in preserving wealth? Or like most of us, do you still need to create wealth? How much risk is right for your temperament and circumstances?
WTWA often suggests a different course of action depending upon your objectives and time frames.
Insight for Traders
We continue both the neutral market forecast, and the bearish lean. Felix is still 100% invested, catching much of the rebound. The more cautious Holmes avoided the downdraft, and has increased overall positions to 25% invested. One of these was a lucky (?) call in Pepco Holdings (POM) two days before the surprise closure of the merger. For more information about Felix, I have posted a further description — Meet Felix and Oscar. You can sign up for Felix and Oscar’s weekly ratings updates via email to etf at newarc dot com. They appear almost every day at Scutify (follow here). I am trying to figure out a method to share some additional updates from Holmes, our new portfolio watchdog. (You learn more about Holmes by writing to info at newarc dot com.
Not using Fibonacci ratios? Really?? Adam H. Grimes explains his conclusion and invites traders to join the debate.
Doug Short occasionally highlights the “best stock market indicator” from John Carlucci. The current conclusion is an untradeable market. Holmes nodded and barked when he heard this.
Insight for Investors
I review the themes here each week and refresh when needed. For investors, as we would expect, the key ideas may stay on the list longer than the updates for traders. Major market declines occur after business cycle peaks, sparked by severely declining earnings. Our methods are focused on limiting this risk. Start with our Tips for Individual Investors and follow the links.
We also have a page (recently updated) summarizing many of the current investor fears. If you read something scary, this is a good place to do some fact checking. Pick a topic and give it a try.
Many individual investors will also appreciate our two new free reports on Managing Risk and Value Investing. (Write to info at newarc dot com).
Other Advice
Here is our collection of great investor advice for this week.
If I had to pick a single most important source for investors to read, it would be this thoughtfully-researched piece from Urban Carmel. He begins with this quotation and comment:
The US economy is stuck in one of the most sluggish recoveries in history. Growth is just 2% and it will remain slow as consumers and companies work off vast amounts of debt. The country has gotten off track and neither political party has any answers.
These sentiments were written in Time in 1992, the year one of the biggest growth eras in American history began. But these same words are often used to describe the current economic environment.
The rest of the article is a delightful compilation of past quotes that seem to fit the current era. It is worth a careful read, and you will find it amusing.
Stock Ideas
- Under Armour (NYSE:UA) illustrates the power of celebrity endorsements. (Jeff Reeves) Upside potential?
- The newest academic studies show that dividend growth is predictable. It takes a combination of factors – not just one.
- Chuck Carnevale explains why these dividends are important. As he always does, he combines theory, data, and specific ideas.
Energy Prices
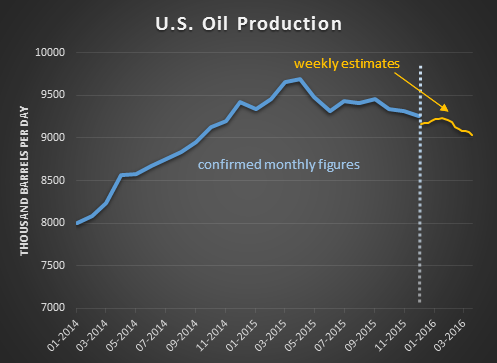
Oil rebound? Dan Dicker at Oil & Energy Insider (subscription required) has ideas about how best to play a rebound. He likes ExxonMobil (NYSE:XOM) as a buyer of a shale player and Blackstone (NYSE:BX) because of their independent power to buy key assets.
Here is an interesting chart from their free edition:
Watch out for….
Bonds. The Personal Finance Engineer analyzes different asset allocations, testing the value of bonds as a way of reducing portfolio volatility. The answer depends a lot on the Fed’s actions.
My sense is that investors can do better.
Personal Finance
Professional investors and traders have been making Abnormal Returns a daily stop for over ten years. The average investor should make time (even if not able to read AR every day as I do) for a weekly trip on Wednesday. Tadas always has first-rate links for investors in this special edition. There are several great posts, but I especially liked this WSJ article on business development companies (BDC’s). A few years ago this was a popular method for getting additional yield by lending to businesses that did not qualify for regular bank loans. Problems are starting to emerge, and people are bailing out of these funds. There is probably a lesson there.
Market Outlook
Tom Lee, one of the most successful strategists in recent years, notes signs that value stocks and small caps are showing good relative strength since the market lows in February. He believes that the prevailing conventional wisdom of dollar strengthening may be incorrect.
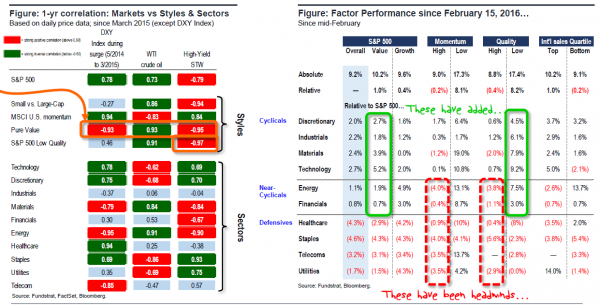
Brian Gilmartin has similar comments about the dollar, suggesting that Q1 '16 may be the trough in the earnings decline.
BlackRock has also turned bullish on U.S. equities.
Final Thoughts
There is continuing tension among the various market viewpoints. It is both too simple and also unhelpful to turn it all into a game of labels.
Investors must have a fundamental method and stick with it. I track the economy (and especially recession potential) because economic growth drives stronger earnings and higher stock prices. Much of the daily news flow is simply noise, distorted further by the simple mental models used by most participants. The three biggest current mistakes are the following:
- Making it all about oil. This viewpoint is sufficiently prevalent that it has created excessive skepticism about economic growth and recession potential.
- Making it all about the Fed. It is fun for most to criticize Fed policy, but not very useful. Most of the actual predictions (hyperinflation, market collapse after the end of QE) have not occurred.
- Making it all about valuation. The most popular methods of market valuation help to keep the average investor scared witless (TM OldProf Euphemism).
Traders have a more difficult challenge. They must guess which of the prevailing, if erroneous, mindsets will dominate on a given day.

