
The economic calendar is normal, with an emphasis on housing. Earnings season begins in earnest, with widespread, high expectations. Especially after Friday’s selloff, many will be wondering:
Do stock prices already reflect strong earnings growth?
Last Week Recap
In my last edition of WTWA I asked whether the Trump Trade had reached a tipping point. That was a good guess, since the week was filled with sharp market moves driven by hints, tweets, comments, and speculation about each. Each day there was a different explanation:
Monday – Trump officials walking back some of the China rhetoric. News of an FBI raid on Michael Cohen’s office seemed link to last-hour selling.
Tuesday – Chinese President Xi Jinping’s speech at the Boao Forum was interpreted as conciliatory. Overnight futures had already rebounded from the late selling but moved much higher on the news.
Wednesday – President Trump warned that a strike against Syria was imminent.
Thursday – Seemed to confuse even the punditry. You can always spot this when they start using “delayed reactions” and a sudden burst of worry about an old issue.
Friday – Strong start from bank earnings turned into selling attributed to “…some geopolitical angst prompted investors to take some money off the table ahead of the weekend”.
These twists and turns are apparent in the chart below. I doubt that “investors” had much to do with them!
The Story in One Chart
I always start my personal review of the week by looking at a great chart. I always start my personal review of the week by looking at a great chart. I especially like the version updated each week by Jill Mislinski. She includes a lot of valuable information in a single visual. The full post has even more charts and analysis, so check it out.

The gain for the week was about 2%, and the trading range was a bit smaller than it has been in recent weeks. I summarize actual and implied volatility each week in our Indicator Snapshot section below.
The News
Each week I break down events into good and bad. For our purposes, “good” has two components. The news must be market friendly and better than expectations. I avoid using my personal preferences in evaluating news – and you should, too!
Feel free to add items that I have missed. Please keep in mind that we are looking for current news, especially from the last week or so. WTWA is not about long-term concerns like debt. These are important, of course, but not our weekly subject unless there has been some major change.
The Good
- High-frequency indicators, remain positive, although the long-leading forecast is weakening a bit. (New Deal Democrat)
- Inflation data – CPI increase was tame although the PPI was up 0.3% versus 0.2% expected. Jill Mislinski takes an “X-Ray view” of the CPI components. Very interesting and quite helpful to those of us (joining the Fed in) keeping a close eye on this issue.

- Sentiment is now “broadly bearish” reports David Templeton of HORAN Capital Advisors. He discusses several sources and multiple sentiment indicators, noting that the bullish/bearish spread of 42.8% in the AAII survey is at a one-year high.

- New tax law shows little impact on home prices. (CoreLogic via Calculated Risk).
- Rail growth remains positive reports Steven Hansen (GEI) using his special focus on the “economically intuitive sectors.” The full post has in-depth analysis and interesting charts.
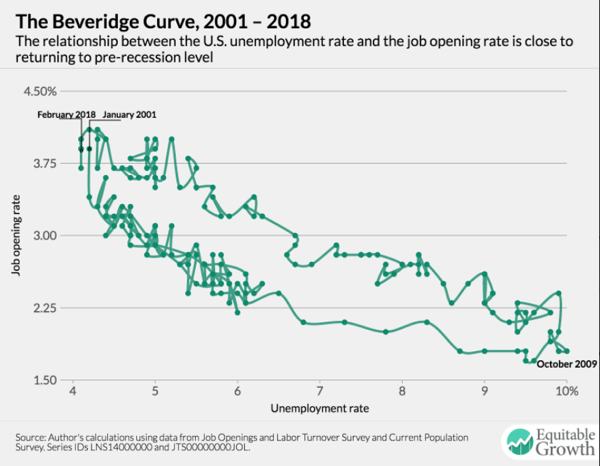
- The Labor Market continues to improve according to JOLTS report data. This much-misunderstood source has two important elements:
- The voluntary quit rate versus layoffs.
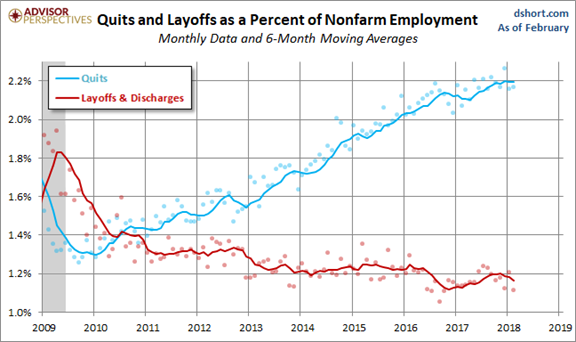
- The Beveridge Curve, providing evidence of where we are in the business cycle. Nick Bunker has the best analysis of JOLTS (HT Brad DeLong). He has great charts and analysis, reported on Twitter. He concludes, “All those concerns that the shift out in the Beveridge Curve during the recovery meant that structural unemployment had risen? Unfounded!!”
The Bad
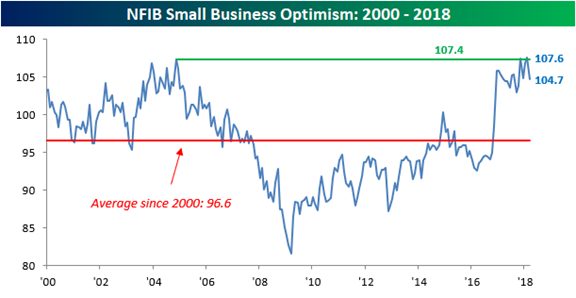
- NFIB Small Business Optimism Index declined from 107.6 to 104.7. This is still a high level, but worth watching. Small business investment and expansion is an important element of economic growth. (Bespoke)
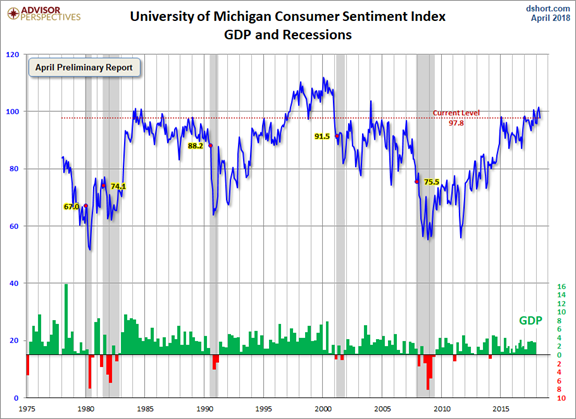
- Michigan sentiment declined from 101.4 to 97.8, missing expectations of 101.6. 29% mentioned trade policies. Those who did had weaker expectations and a higher inflation expectation. (Jill Mislinski).
- Hotel occupancy is down 2.7% on a year-over-year basis. (Calculated Risk)
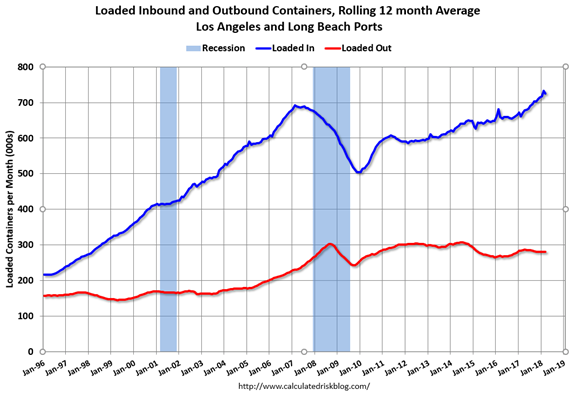
- LA Area Port Traffic Declined in March, in spite of a record Q1 2018 for Long Beach. Calculated Risk analyzes the effects, include the impact of the Chinese New Year. In general, the pattern is one of rising imports and flat exports.
- Debt projections. This is not a new story, but there were important reports this week. The CBO released new projections. Brookings has an excellent analysis, noting as follows:
The Federal government is not only running enormous deficits, but we are doing so at a time of full-employment. When the inevitable recession comes, we will be in deep trouble.
Here’s the bad part: Under current law, CBO projects that the debt—currently 77 percent as large as annual GDP—will rise to 96 percent of GDP by 2028. And that’s if Congress does nothing. If instead, Congress votes to extend expiring tax provisions—such as the many temporary tax cuts in the 2017 tax overhaul—and maintain spending levels enacted in the budget deal (which is called the “current policy” baseline), debt is projected to rise to 105 percent of GDP by 2028, the highest level ever except for one year during World War II (when it was 106 percent).
Meanwhile, expectations for economic growth, and therefore more revenue, have become more modest. Dr. Ed Yardeni cites newly-appointed Fed Vice Chairman John Williams as pegging the trend growth rate as 1 ¾ percent. Dr. Ed writes:
I was surprised by his comment that the trend in real GDP is only 1.75%. That certainly is at odds with the predictions of President Donald Trump and his supply-side advisers, who believe that their policies will boost real GDP growth up to the old normal of 3.0% and even 4.0%. I have been expecting more of the same, i.e., 2.0%-2.5%.
The Ugly
Syria. The gassing of civilians. The reprisals. The risk of escalation.
The Week Ahead
We would all like to know the direction of the market in advance. Good luck with that! Second best is planning what to look for and how to react.
The Calendar
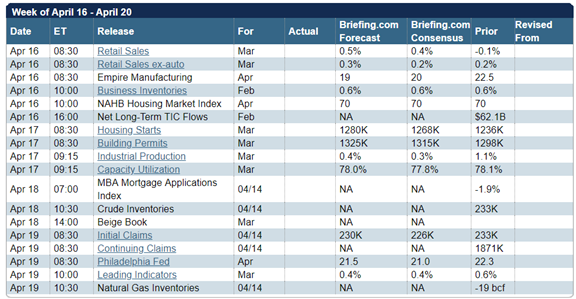
We have a normal economic calendar, featuring retail sales and housing data, including starts and permits. Corporate earnings will outrank the data in significance.
Briefing.com has a good U.S. economic calendar for the week (and many other good features which I monitor each day). Here are the main U.S. releases.
Next Week’s Theme
The economic calendar emphasizes housing data and retail sales, but attention will turn to corporate earnings reports for Q118. The strong early reports on Friday failed to sustain an early rally in stocks. This caused many to describe this as a “sell the news” situation.
The quest to find an explanation for every market move left many wondering if a strong earnings season was “baked in” to stock prices. Unless earnings reports fuel a more sustained rally, I expect many to be asking:
Do Stock Prices Already Reflect Strong Earnings Growth?
To answer the question, we cannot avoid some analysis of what is behind the market moves. In my review of last week, the daily analysis offered little of substance. Let’s organize it by the market significance of the issues, understanding that the social or human importance is much different. Drawing upon several of the better market commentators and my own observations, I suggest the following:
- Threats to free trade generate the biggest response, with many fearing more than the initial impact on GDP.
- Immigration has a major impact on economic growth. So far, this has gotten little attention, but it is relevant to earnings.
- Scandals and accusations have a knee-jerk effect, but no clear link to stocks. The headline risk is a gridlocked malaise. The few historical analogies are negative for stocks, but without a clear causal link or analysis of similarities and differences.
- International crises. Once again, these threats generate an immediate market reaction. Some traders sell because they know that others will be selling.
In all of these cases a trading reaction often gets an investment interpretation. We must balance this against the expected earnings growth, perhaps over 20%, and the potential impact on stock prices. The bottom-up target price for the S&P 500 is an increase of 16.2%. John Butters calculates this by aggregating the median target price estimates from industry analysts.
Barron’s asks whether earnings will save the rally.
As usual, I’ll save my own conclusions for today’s Final Thought.
Quant Corner
We follow some regular featured sources and the best other quant news from the week.
Risk Analysis
I have a rule for my investment clients. Think first about your risk. Only then should you consider possible rewards. I monitor many quantitative reports and highlight the best methods in this weekly update.
The Indicator Snapshot
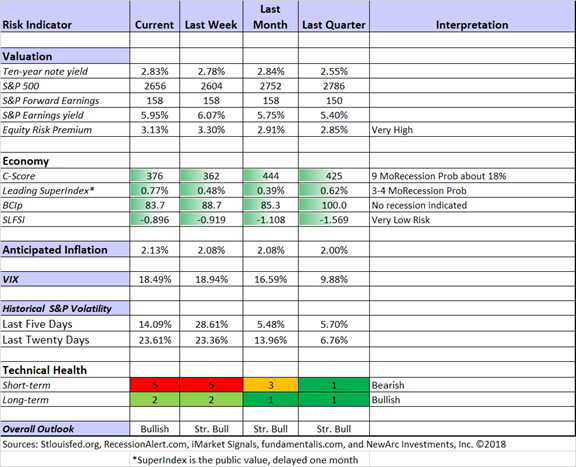
Short-term trading conditions remained poor this week. In mildly bearish conditions our trading approaches can still be profitable, but that might not be true for everyone. We continue to monitor the technical health measures on a daily basis. If this indicator goes to fullish bearish, we liquidate trading (not investment) positions. We are not quite at that point, but I have rounded the result to “5.” This is not a forecast that the market will decline. It indicates increased difficulty in trading profitably.
The long-term fundamentals and outlook are little changed. Based upon historical data for this indicator, I have increased the 9-month recession probability to the 18% range. I am monitoring, but not yet especially worried. The long-term technical health is 1.5, but I rounded it up.
The Featured Sources:
Bob Dieli: Business cycle analysis via the “C Score.
RecessionAlert: Strong quantitative indicators for both economic and market analysis.
Brian Gilmartin: All things earnings, for the overall market as well as many individual companies.
Georg Vrba: Business cycle indicator and market timing tools. None of Georg’s indicators signal recession.
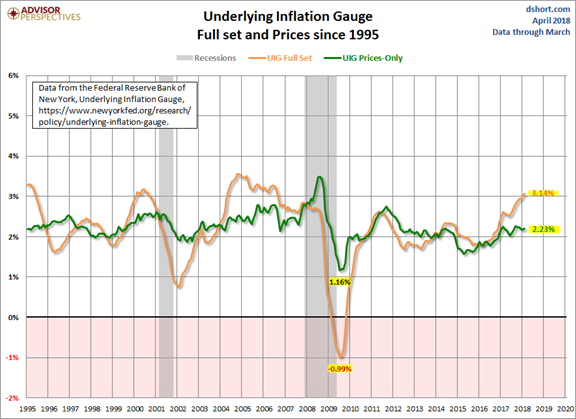
Doug Short and Jill Mislinski: Regular updating of an array of indicators. Great charts and analysis.
Jill has initiated coverage of the NY Fed’s Underlying Inflation Gauge, intended to complement current measures by identifying the trend.
Guests:
David Templeton (HORAN Capital Advisors) takes a closer look at search data on the term “Tariffs” and the S&P 500 data. It would be wise to consider this in conjunction with the University of Michigan sentiment data discussed above. He looks at several factors linked to recessions, especially oil prices.
Insight for Traders
Check out our weekly Stock Exchange post. We combine links to important posts about trading, themes of current interest, and ideas from our trading models. This week we asked, “How do you allocate your trade risk budget?” As usual, we discussed some stock ideas and updated the ratings lists for Felix and Oscar, this week featuring high-liquidity midcap stocks. Blue Harbinger has taken the lead role on this post, using information both from me and from the models. He is doing a great job, presenting a wealth of new ideas and information each week.
As is often the case, the theme of a “risk budget” applies to investors as well.
Insight for Investors
Investors should have a long-term horizon. They can often exploit trading volatility! I remind investors of this each week, but now is the time to pay attention.
Best of the Week
If I had to pick a single most important source for investors to read this week it would be Dan Egan’s excellent (recently updated) post about safety net funds, Why Traditional Advice is Wrong.
He writes:
First, let’s get one myth out of the way: Cash savings accounts are not risk free. Why? Because after accounting for inflation there is about a one in three chance you won’t get back the money you put in, in real terms.
Today, with nominal cash interest rates hovering far beneath 1 percent, it’s almost guaranteed that you’ll make a negative real return over the next few years. This means your safety net fund will need topping up year after year to maintain its real value. It also means that you’ll have a significant amount of wealth that is not growing, potentially for a long period of time.
He goes on to show the benefit of including a stock allocation, analyzing 40% as an example. He considers 50 years of rolling-five year periods and analyzes the worst cases.
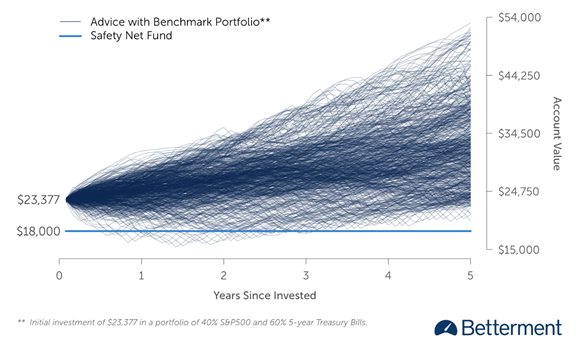
No formulaic allocation is right for everyone, but this is a good illustration. Most investors who are 100% allocated to cash for safety funds or more do so from fear. Julie Segal explains why investors should just calm down when volatility goes up, citing research from Prudential (LON:PRU) Financial’ s global investment group. The results report investment returns before, during, and after volatility spikes.
Stock Ideas
Chuck Carnevale demonstrates how to find some attractive stocks with an overvalued S&P 500. He also sees valuation excess in the dividend aristocrats.
Blue Harbinger (not to be confused with Blue Horseshoe) likes Simon Property Group (NYSE:SPG).
Brian Gilmartin considers the underlying fundamentals in his analysis of the long-term breakout in financial stocks.
Barron’s (subscription required) likes Cummins (NYSE:CMI) and so do I after making a recent buy on what I regard as a “dip.” I also agree with the reason – a knee-jerk with hunt for big industrials with China exposure.
Peter F. Way uses his market-maker ratings to find the most attractive DJ 30 stocks for the next 3-6 months.
Time for some biotech? John McCamant identifies his “Four Horsemen.”
Chip stocks? Deutsche Bank (DE:DBKGn) is generally cautious but likes the near-term chances for five choices. (24/7) We own one of them with another on our “watch” list.
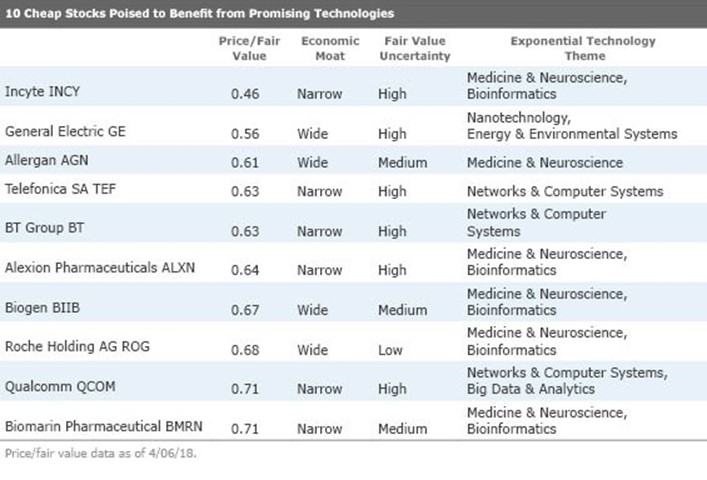
Morningstar looks for companies with exponential technology, reasonable valuation, and high quality. Here are the top ten candidates:
Personal Finance
Seeking Alpha Senior Editor Gil Weinreich has expanded his excellent series for financial advisors (and serious individual investors) to include some podcasts. His comments on the projected $1 trillion deficit (also discussed above) is brief, accurate, and to the point. You will also appreciate these insights on raising your retirement income from Prof. Laurence Kotlikoff.