
The economic calendar is normal, with an emphasis on inflation data and the Fed. The increased intra-day volatility, often driven by overnight comments in China news or a Presidential tweet, has everyone’s attention. Even Fed punditry will take a back seat. With an increased sense of urgency, many will be wondering:
Has the Trump Trade reached the tipping point?
Last Week Recap
In my last edition of WTWA I asked whether stock prices had veered from the fundamentals. That was a good guess, since the topic was popular in discussions all week.
The Story in One Chart
I always start my personal review of the week by looking at a great chart. I always start my personal review of the week by looking at a great chart. I especially like the version updated each week by Jill Mislinski. She includes a lot of valuable information in a single visual. The full post has even more charts and analysis, so check it out.

The loss this week was only 1.4%, but the dramatic daily moves made it seem like more. The trading range was 4.8% including 3% in a single day. I summarize actual and implied volatility each week in the Indicator Snapshot.
The News
Each week I break down events into good and bad. For our purposes, “good” has two components. The news must be market friendly and better than expectations. I avoid using my personal preferences in evaluating news – and you should, too!
Feel free to add items that I have missed. Please keep in mind that we are looking for current news, especially from the last week or so. WTWA is not about long-term concerns like debt. These are important, of course, but not our weekly subject unless there has been some major change.
The Good
- High-frequency indicators, although softening a bit, remain solidly strong. Check out New Deal Democrat’s valuable weekly report.
- March Auto sales were strong, especially at GM. (Automobilemag).
- Earnings guidance has been strong, especially in tech. (FactSet).

- ADP private payrolls gained 241K, about the same as last month, but beating expectations of 203K.
- February Factory orders rebounded to a gain of 1.2% from January’s 1.4% decline. This was still a little below expectations.
- Rail traffic is up 5% year-over-year. (Steven Hansen, GEI). Truck shipments are also improving on a year-over-year basis.
- Sentiment remains bearish, a contrarian indicator. Bespoke.

The Bad
- ISM index for March registered 59.3 declining from the prior 60.8 and missing expectations of 60.0. Scott Grannis takes a deeper look and sees strong numbers.
- ISM services for March registered 58.8 narrowly missing expectations of 59.
- Construction spending for February gained only 0.1% v expectations of 0.5%.
- Initial jobless claims spiked to 242K from last week’s 218K.
- Nonfarm payroll employment increased by only 102K net jobs, missing expectations of 175K. The prior two months were revised lower by 50K. The Household survey was also weaker than expected, although other metrics were unchanged. James Picerno combines the headline data in this chart:

The Ugly
An unwanted Korean war? Foreign Affairs explains how it could happen. Secret direct talks suggest that there is some progress in mitigating this threat. The planned summit between President Donald Trump and North Korea leader Kim Jong Un should be watched closely. Stratfor (via GEI) has a deeper look about why the current
The Week Ahead
We would all like to know the direction of the market in advance. Good luck with that! Second best is planning what to look for and how to react.
The Calendar
We have a normal economic calendar, featuring inflation data and the FOMC minutes. The JOLTs report will also contribute to the normal tendency for a focus on the Fed.
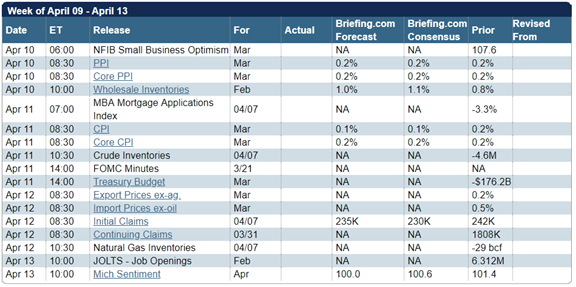
Briefing.com has a good U.S. economic calendar for the week (and many other good features which I monitor each day). Here are the main U.S. releases.
Next Week’s Theme
The economic calendar includes the FOMC minutes, inflation data, and the JOLTs report. All of these are of interest to Fed-watchers. Normally that would be our theme for the week.
Instead, there is a sense of unease among many. Those closely following stocks are observing wild daily swings – as much as 1000 Dow points in slightly over one trading day. The trading swings are not driven by “real” news about earnings or the economy. Instead we get a statement from China affecting futures trading while US markets are closed. Then there are surprise tweets and announcements during the trading day.
When a surprise hits the wire, algorithms apply recent computer learning, human traders react, support and resistance levels are hit, and moves can become larger. My younger blogging colleagues would say, “What the heck (TM OldProf euphemism) is going on?”
For the punditry, the volatility combined with the loss of the early gains for the year has them wondering. I expect many to be asking:
Is this the tipping point for the Trump Trade?
Usually I offer a range of viewpoints in this section. There are certainly many who expect an imminent market decline, and some expect a large one. Others question the underpinnings of the “Trump Trade.”
You can find such viewpoints easily enough. In doing my research this week I was struck by how many colleagues whom I respect shared my current attitude: Solid fundamentals for stocks, but continuing, unsettling threats. Here is a review of some experts and thought leaders.
- David Templeton, HORAN Capital Advisors.
I can list a number of additional potential negative issues with any single one being a headwind for the equity market: rising interest rates and consequent flattening yield curve, growth in deficit spending out of Washington and more. All but the interest rate factor are mainly political events and I would say business fundamentals and economic fundamentals remain more important variables for the market right now. Given some of the negative factors cited, just maybe the market will climb the proverbial wall of worry.
- Urban Camel, The Fat Pitch, does a comprehensive summary of indicators, concluding as follows:
In summary, the major macro data so far suggest positive but modest growth. This is consistent with corporate sales growth. SPX sales growth in 2018 is expected to only be about 6-7% (nominal).
Valuations are back their 25 year average. The consensus expects earnings to grow about 18% in 2018 and 10% in 2019. Equity appreciation can therefore be driven by both corporate growth as well as valuation expansion (chart from JPM).
- “Davidson” via Todd Sullivan covers a key point about market leadership.
FANG issues are responsible for most of the current correction. Investors typically sell other issues a little lower as well. Seeking Alpha published a note on new FANG futures last fall. The chart of this group is below.
Economic activity continues to be strong. Once the FANG correction is over, I expect markets to rise to new highs.

- Eddy Elfenbein notes the decline below the 200-day moving average of the S&P 500. He uses the ratio of the equal-weighted S&P 500 to the cap weighted version as a measure of the opportunity for stock picking. Read the entire post for his typically clear explanation of how the rotation from high-fliers provides opportunity.

- Dr. Ed Yardeni sees no slowdown in global economic stats. Check out his thorough review.
As usual, I’ll save my own conclusions for today’s Final Thought.
Quant Corner
We follow some regular featured sources and the best other quant news from the week.
Risk Analysis
I have a rule for my investment clients. Think first about your risk. Only then should you consider possible rewards. I monitor many quantitative reports and highlight the best methods in this weekly update.
The Indicator Snapshot

Short-term trading conditions worsened this week. In mildly bearish conditions our trading approaches can still be profitable, but that might not be true for everyone. We continue to monitor the technical health measures on a daily basis. If this indicator goes to fullish bearish, we liquidate trading (not investment) positions. We are not quite at that point, but I have rounded the result to “5.” This is not a forecast that the market will decline. It indicates increased difficulty in trading profitably.
The long-term fundamentals and outlook are little changed. Based upon historical data for this indicator, I have increased the 9-month recession probability to the 18% range. I am monitoring, but not yet especially worried. The long-term technical health is 1.5, but I rounded it up to reflect the change.
The Featured Sources:
Bob Dieli: Business cycle analysis via the “C Score.
RecessionAlert: Strong quantitative indicators for both economic and market analysis.
Brian Gilmartin: All things earnings, for the overall market as well as many individual companies.
Georg Vrba: Business cycle indicator and market timing tools. None of Georg’s indicators signal recession.
Doug Short: Regular updating of an array of indicators. Great charts and analysis.
Insight for Traders
Our discussion of trading ideas has moved to the weekly Stock Exchange post. The coverage is bigger and better than ever. We combine links to trading articles, topical themes, and ideas from our trading models. Each week we explore a topic of current interest, drawing upon trading experts. This week we asked, “Are you a contrarian trend follower?” As usual, we discussed some stock ideas and updated the ratings lists for Felix and Oscar, this week featuring midcap stocks. Blue Harbinger has taken the lead role on this post, using information both from me and from the models. He is doing a great job, presenting a wealth of new ideas and information each week.
While my intent is to focus on traders, long-term investors may also benefit. That was especially true in this week’s post.
Insight for Investors
Investors should have a long-term horizon. They can often exploit trading volatility! I remind investors of this each week, but now is the time to pay attention.
Best of the Week
If I had to pick a single most important source for investors to read this week it would be Scott Grannis’s review of Fed policy, the QE effects, and where things stand now. This misunderstood topic serves to prevent many financial analysts from a clear view of the fundamentals. The charts and explanations can help you avoid this trap.
To this day there are still legions of observers who argue that what the Fed did starting in late 2008 was simply a massive amount of money-printing, a desperate monetary stimulus that was necessary to avoid a depression, and the economy has been running on fumes ever since.
Others, myself included, believe that what the Fed did was not monetary stimulus at all. It was simply a rational response to an unprecedented increase in the public’s demand for money and money equivalents, which in turn was the result of the near-collapse of the global financial system and the worst global recession in modern memory. The world was running very scared, so the demand for safe monetary assets was nearly insatiable. Unfortunately, there were not enough T-bills (the classic monetary safe haven) to go around. By deciding to pay interest on bank reserves, the Fed effectively made bank reserves equivalent to T-bills, and that was exactly what the world wanted: trillions more of safe, default-free, interest-bearing assets, and the Fed had the ability to create bank reserves with abandon if need be.

Stock Ideas
Chuck Carnevale combines the key elements of interest for many investors: Dividend growth and reasonable valuations. He has 50 (count ’em) ideas! As usual, the candidates come with a video lesson. You can learn while you earn.
General Motors (NYSE:GM)? Valentum highlights the attractions.
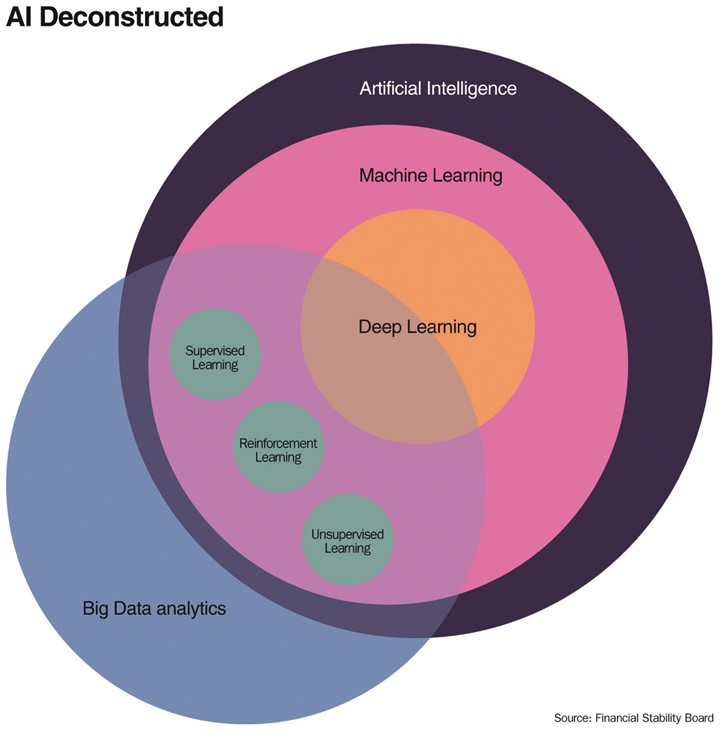
Artificial intelligence stocks? Barron’s has a cover story on this theme.
Personal Finance
Seeking Alpha Senior Editor Gil Weinreich is taking some well-deserved time off, as is Abnormal Returns. Tadas invited a group of financial bloggers to comment on a series of interesting questions. This sparked everyone, including me, to consider some topics we might not have mentioned otherwise. I especially liked the post on what we have learned in the last ten years, but the whole series is valuable.
Final Thoughts
When confronted with an economic threat, it is always wise to consider the worst-case possibility. You can then modify the possible outcomes a bit, changing with the evidence. I have reached the following conclusions:
- Expected earnings are at attractive levels and growing quickly.
- The near-term recession odds are very low.
- The investing alternatives remain relatively unattractive.
- Market volatility has increased, back to normal historic levels or even a little above.
- The volatility centers on the every-changing trade war story.
What is the worst case from a trade war? Estimates suggest it would lower world GDP growth from about 3.5% to 2.5% in China and the US – a reasonable level, but not the fuel for a big rally in stocks.
Since none of the US or China proposals will take effect for two months, there is plenty of time to negotiate and modify positions. On the US side there is evidence that this is already happening with close allies.
But there is a reason for additional worry – the loss of business confidence. And also, the question about how much earnings growth is already anticipated. (Brian Gilmartin).
One can be more philosophical about the worst case when it is happening to someone else!
The loss of confidence for expansion and investment could be more of a tipping point than the trade war itself. This earnings season is important beyond the numbers. What will companies say about trade effects on their future plans?
I’m more worried about:
- Escalating trade rhetoric. This issue rises and falls on the worry list with greater and greater frequency.
- Trader frustration. It is not so much the higher volatility, but the causes. Market participants always have surprises from Washington, but usually it is possible to follow the issues. That reduces the chance of being caught “offsides.”
I’m less worried about:
- North Korea. There are signs of some real progress.
- The Fed. There is no reason to expect accelerated action that would worry markets.
Do the economic challenges seem complicated and threatening? You might find help in my paper on getting back in the market, the top investor pitfalls, or my suggestions about managing risk. Just write for our free information on these topics. While they describe what I am doing, the do-it-yourself investor can apply the same principles. These are available for free from main at newarc dot com