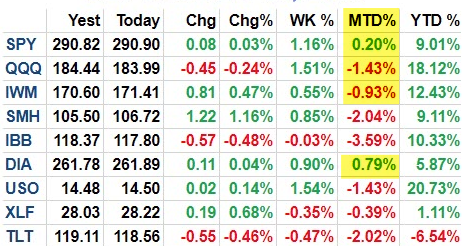
Summary: Mid-way through September, US equities are flat to lower for the month. The longer term trend is positive but the near-term outlook is unfavorable. It seems unlikely that any equity weakness will be substantial or long lived, but investors should remain on alert to heightened risk over the next several weeks. We believe that will be a good set up for gains into year end.
Mid-way through September, US equities are flat to lower for the month (table from alphatrends.net). Enlarge any chart by clicking on it.
Our perspective two weeks ago was that:
Years like 2018, where the SPX is up 5 months in a row and up between nearly 10% through August, have a strong propensity to continue higher to the end of the year. That view is supported by long term measures of sentiment and positive economic fundamentals
If there is a reason for caution, the risk is mostly short-term (within the next month). Strong Augusts have a propensity to trade lower in September, a view further supported by short-term measurements of complacency (like the put/call ratio)
That perspective has not changed. Data supporting this view can be found here.
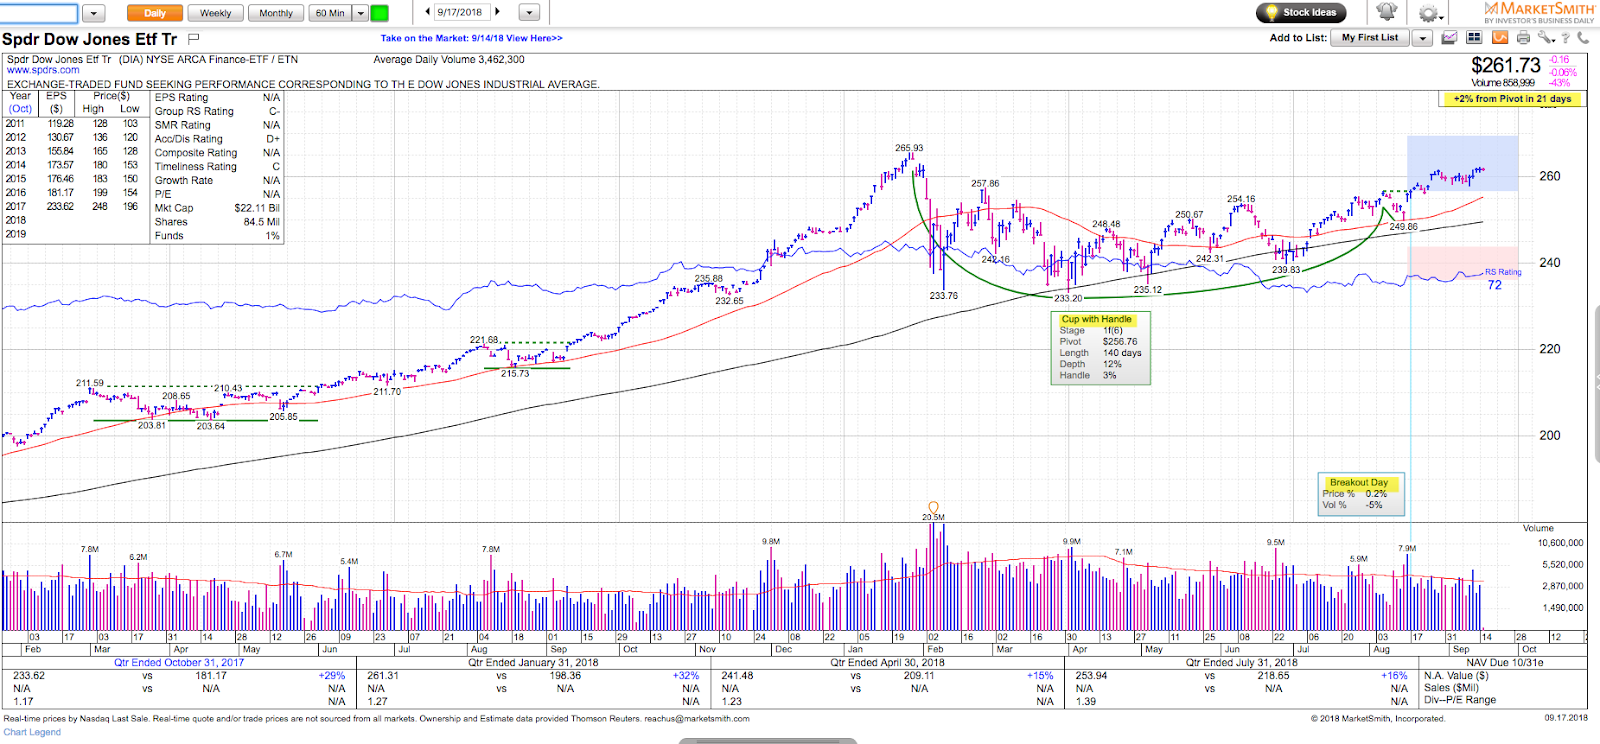
Among the major US indices, the Dow Industrials has been the weakest. SPX, the Nasdaq and both the Russell 2000 and Russell 3000 have all made new all-time highs (ATH) in the past two weeks. DJIA has not yet exceeded its January high. But the pattern is constructive and last week DJIA traded to a new 8-month high.
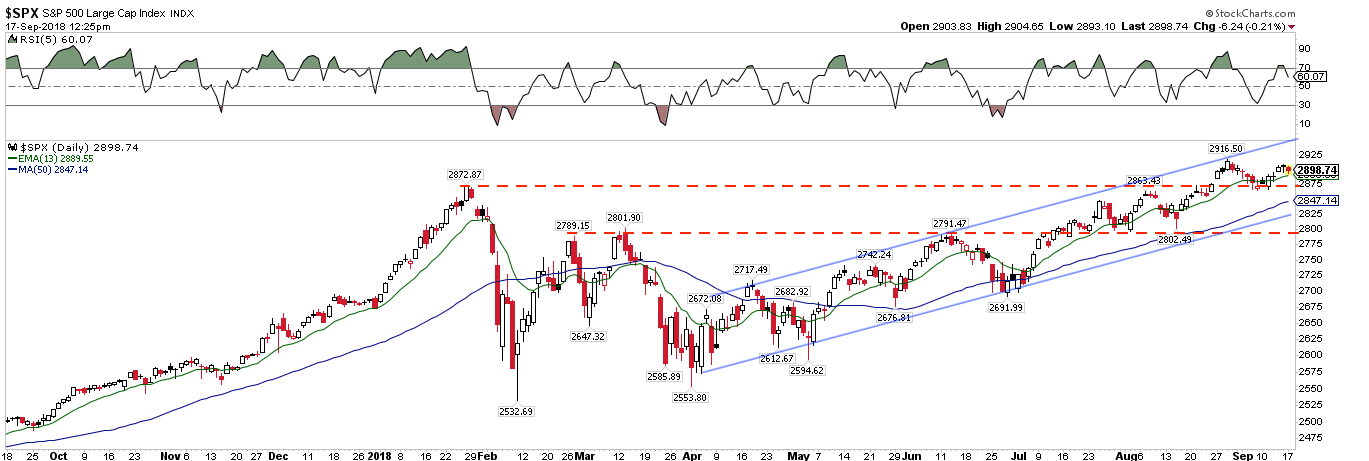
SPX reached the top of a 5-month rising channel in early September (blue line) and then successfully retested the breakout above its January high (top red line). So far, there's no foul. But a return to 2870 likely leads to a break lower, to the 50-d, the bottom of the rising channel or to 2800 (bottom red line). There is plenty of support and the worst of these outcomes represents a total decline of just 4%.
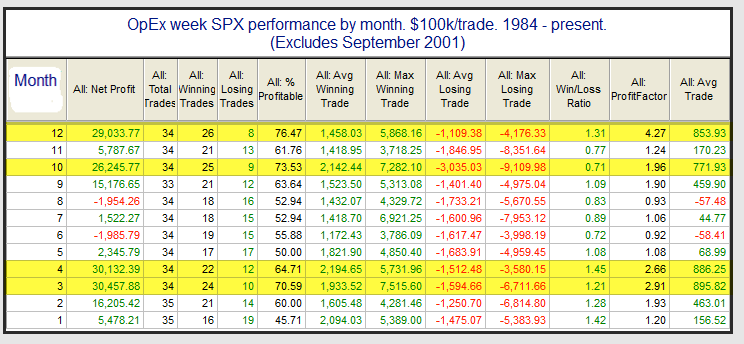
SPX ended last week on a 5 day in a row winning streak. The last 18 such winning streaks all led to at least one higher close within the next 5 days, so further gains sometime this week should be expected. Moreover, September options expiration is on Friday and the week has a mild bullish inclination (from Quantifiable Edges; click for the full article).
But there remain a number of short term watch outs.
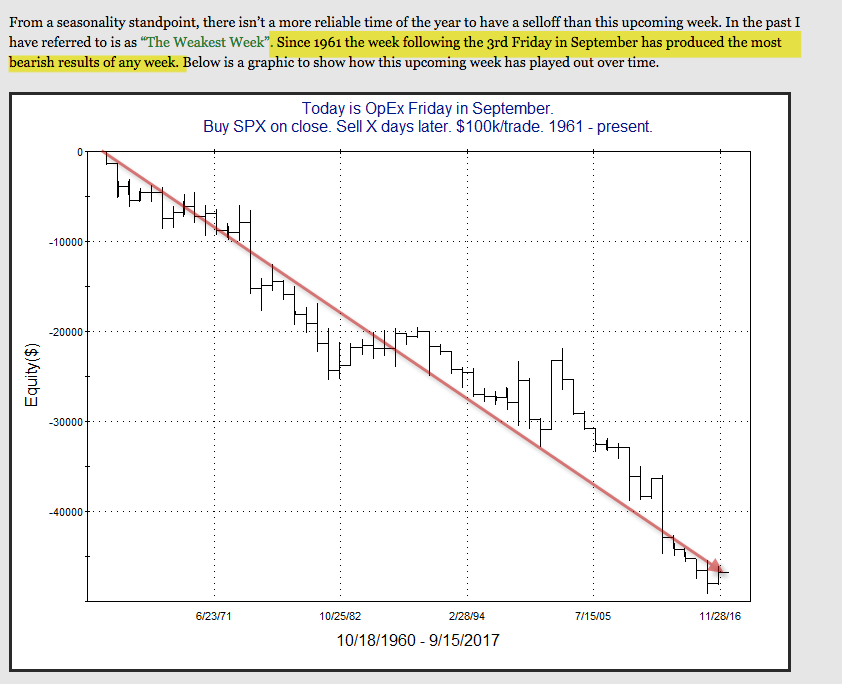
First, the week after September options expiration is the "weakest week" of the year. In the 27 years since 1990, SPX has traded down through Thursday a remarkable 82% of the time (from Quantifiable Edges; click for the full article).
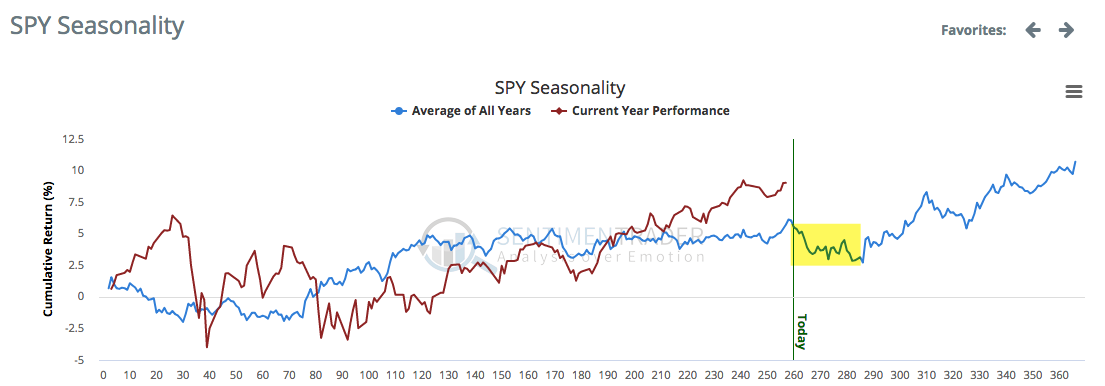
Historically, the end of September and into October is a weak period for US equities. That typically sets up a rally into the elections in early November.
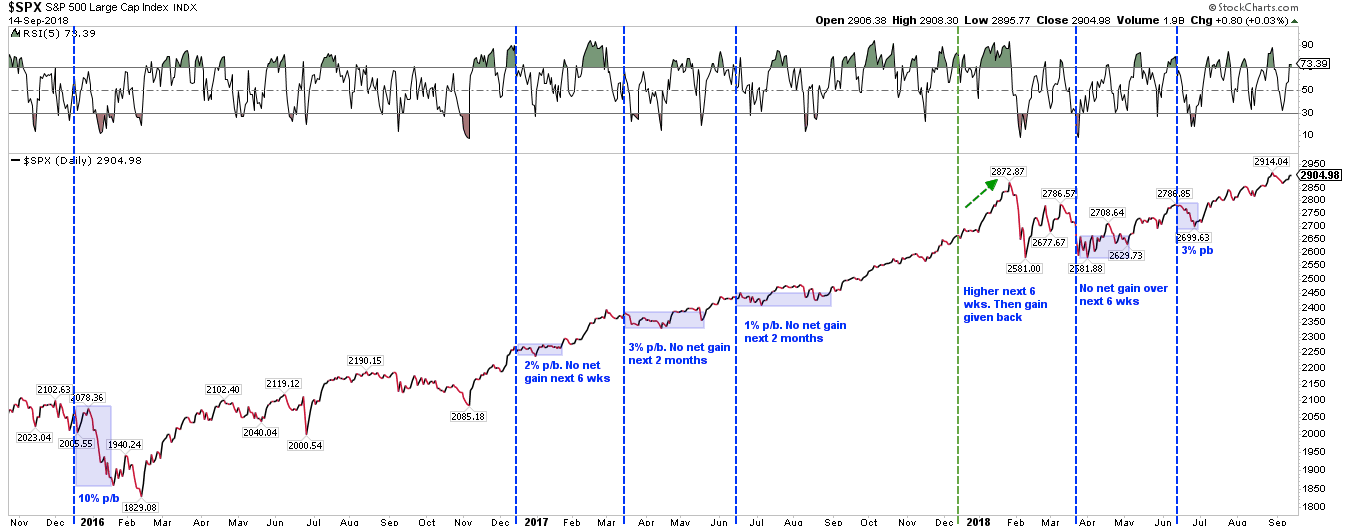
Second, the FOMC meets a week from Wednesday and the odds of a rate hike are over 90%. There have been 7 rate hikes since 2015 and all but one has coincided with a downdraft in US equities. The one exception came last December when the large tax reform package was approved.
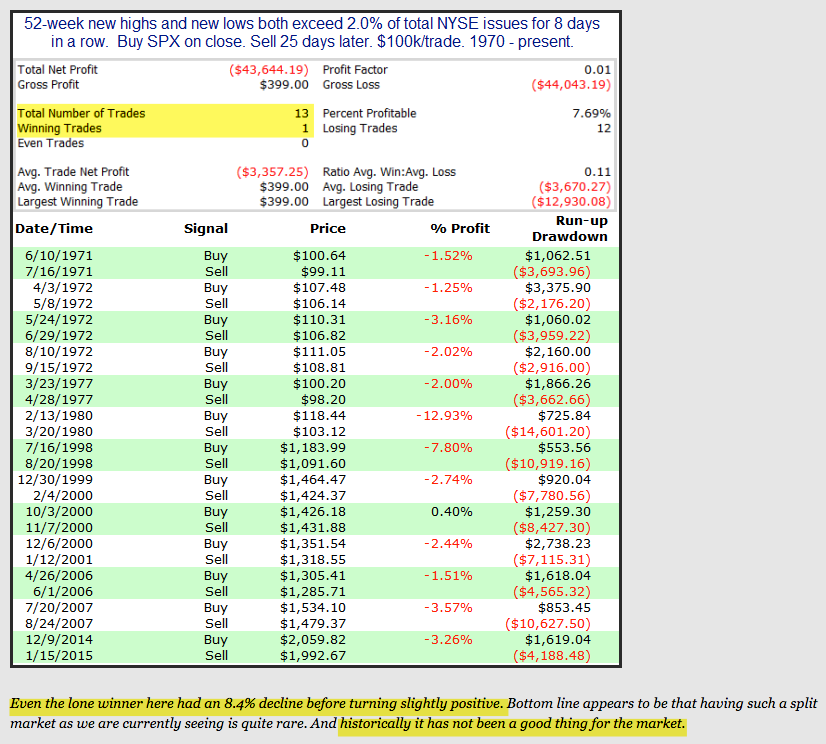
Third, market breadth has split: while some stocks are hitting new highs, many others are hitting new lows. When this happens every day for a week or more, the SPX has almost always traded lower over the next month: since 1970, all 13 instances have preceded losses (from Quantifiable Edges).
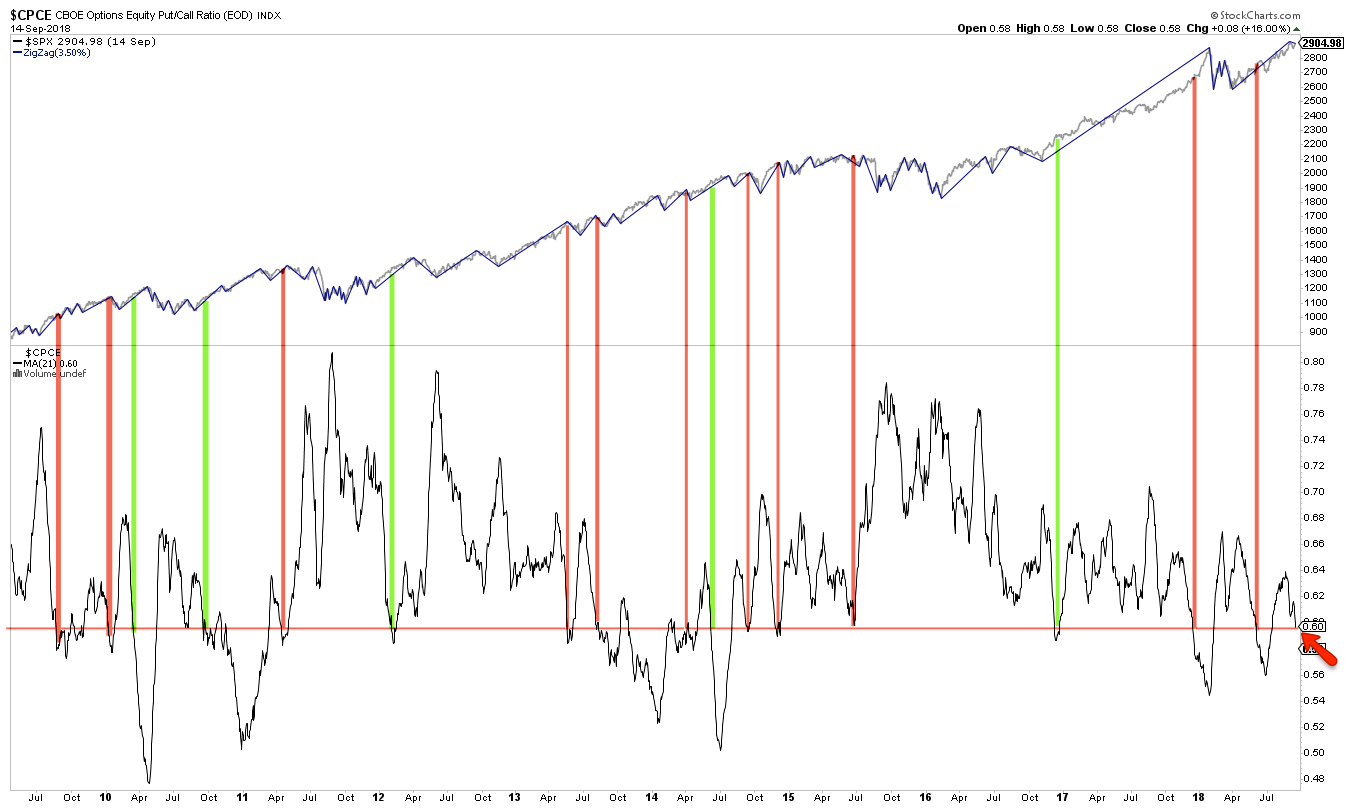
Finally, the equity-only put/call ratio continues to drop, showing a rise in short-term investor complacency. The one-month average is at the same level as in mid-June, before a 3% fall in SPX. This signal can be early (as in December 2017); most of the failures have occurred after notable lows in SPX (e.g., mid-2010, early 2017). It would easier to look past this indicator if the others mentioned above were not also present.
It seems unlikely that any equity weakness will be substantial or long lived, but investors should remain on alert to heightened risk over the next several weeks. We believe that will be a good set up for gains into year end.
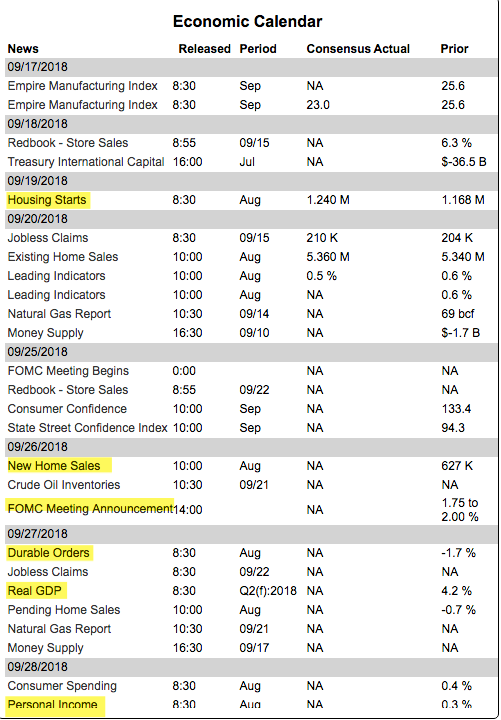
On the calendar over the next two weeks: housing starts this Wednesday and OpX on Friday; FOMC and new home sales a week from Wednesday, GDP and durable goods that Thursday and PCE that Friday (from IBD Investors).
