Summary: A week ago, a number of notable short-term extremes in sentiment, breadth and volatility had been reached, suggesting a rebound in equities was ahead. In the event, US equities gained 1% and both NDX and COMPQ made new ATHs.
But new uptrends are marked by indices impulsing higher as investors quickly reposition and chase price. Momentum quickly becomes overbought. Neither of these has happened, at least not yet. Some clarity from the French elections this weekend could free equities to move higher. Should SPX instead rollover, breaking the recent low on April 13 and head to the 2300 area, it's a good guess that a stronger rebound will follow: there are several indications that short-term investor sentiment has already become too bearish.
Since reaching an all-time high (ATH) on March 1, SPX has traded sideways in a 3% range. The ATH came on the day of the new president's State of the Union address and also corresponded with bullish sentiment extremes in, for example, the equity-only put/call ratio and the Investors Intelligence survey. Our recent posts have emphasized that these extremes, together with the subsequent loss in price momentum, are most often associated with a mild correction of 3-5%. A return to the 2300 area for SPX appeared to be odds-on. Read more on these points here and here.

A week ago, however, a number of notable short-term extremes in sentiment, breadth and volatility were reached, suggesting a rebound in equities was ahead. A post on this is here. In the event, SPX gained 1% this past week while NDX gained nearly 2% and made a new ATH. The rally this past week was led by small cap stocks, with RUT gaining 2.6%. VIX fell 8%.
Given the set-up, this past week's rebound in SPX was mild. It does not look like the start of a new uptrend, at least not yet. While SPX gained for the week, the index fell 3 out of the past 5 days. By Friday, all the index had managed to accomplish was to retest its broken 50-dma.
New uptrends most often impulse higher as investors quickly reposition and chase price. In the first five days of a new uptrend, the index can gain 3-5% (lower panel). Momentum quickly becomes overbought (upper panel). These are positive signs. Examples over the past four years are highlighted below.
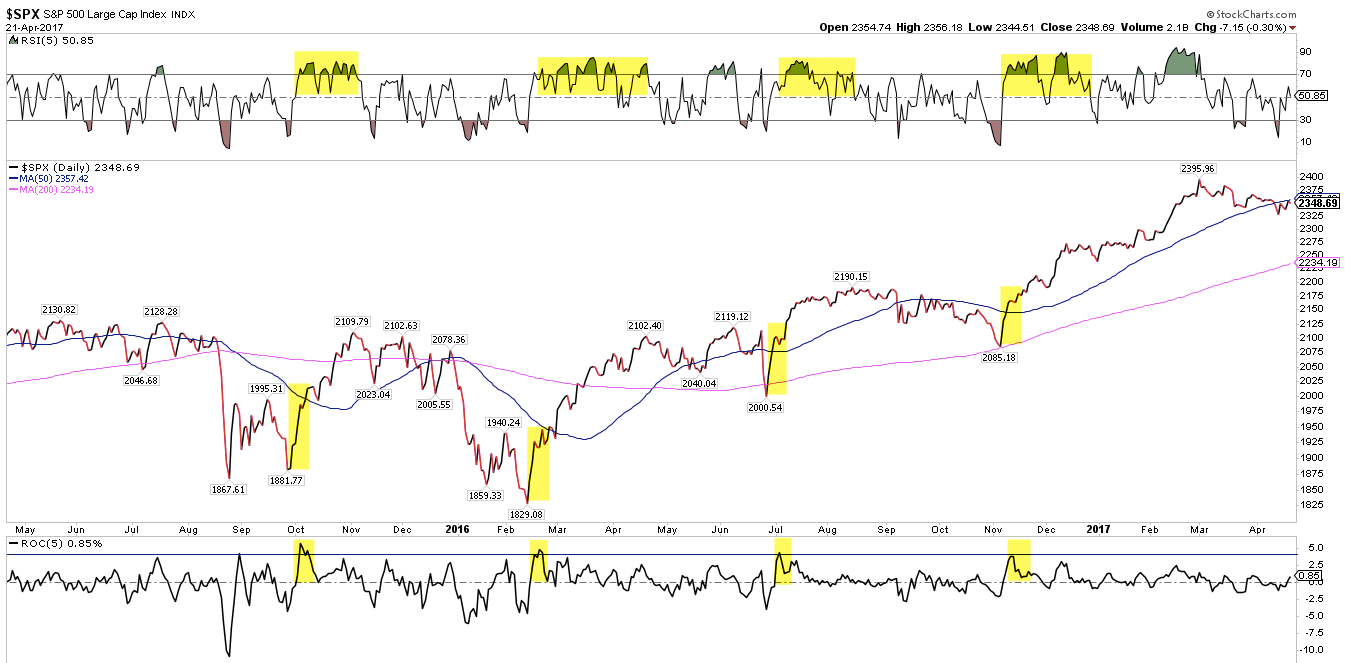
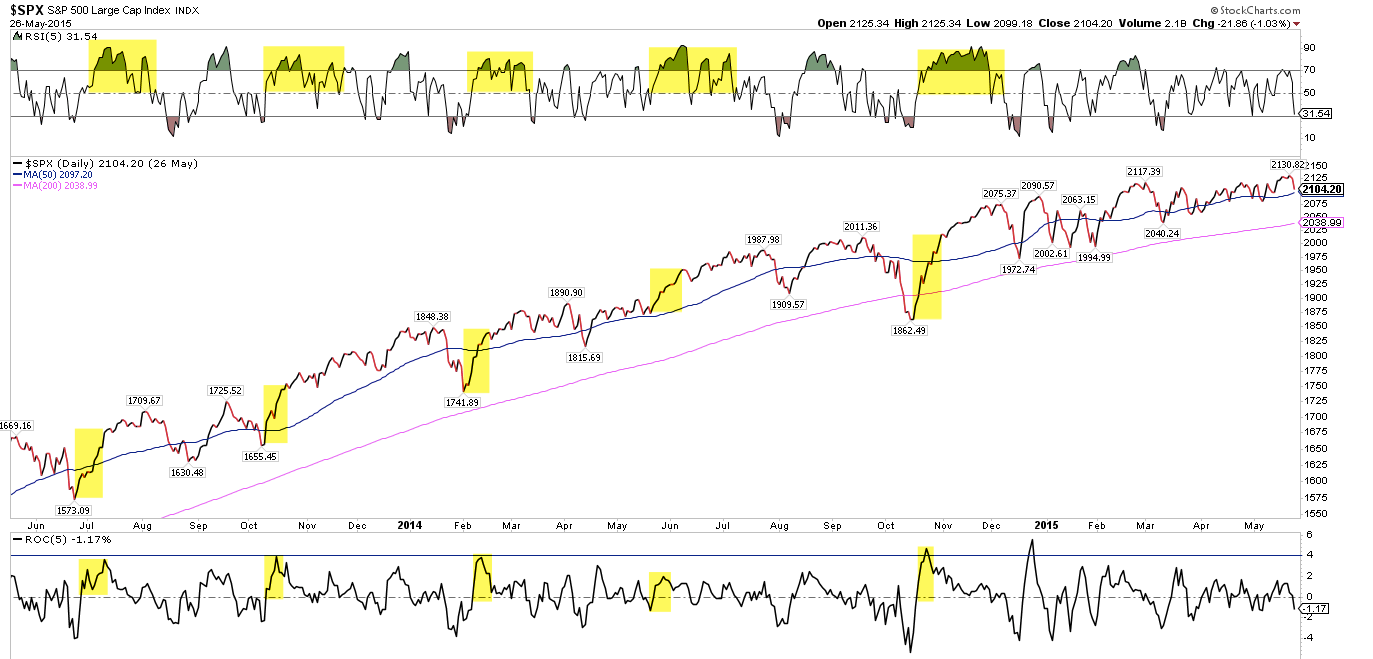
So far, SPX is not impulsing higher at all, and momentum is only just back to neutral. Until these change, it's a good guess that SPX is likely to roll over and complete its mild correction to the 2300 area.
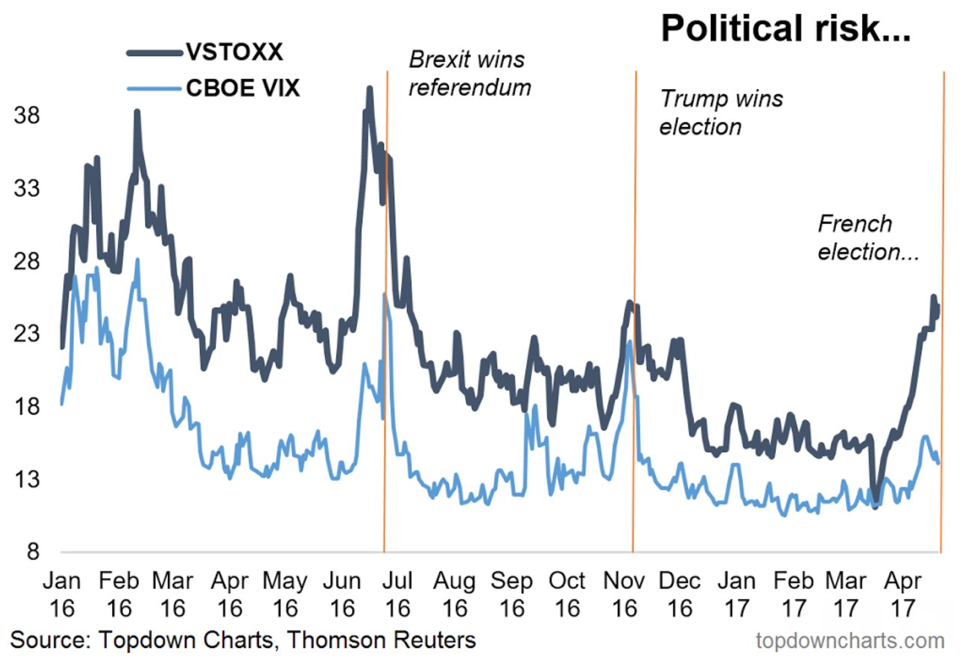
Admittedly, it could be that this weekend's French election has been weighing on the US. While VIX fell this past week, the STOXX 50 Volatility index, the index for Euro Stoxx shot higher (dark blue line). This helps explain the pattern of overnight weakness in US futures over the past month. Some clarity could free SPX to move higher this upcoming week (from Callum Thomas).
Should US equities instead roll over, breaking the recent low on April 13 and head to the 2300 area, it's a good guess a stronger rebound will follow. For one, such a move would complete the 3-5% mild correction that happens regularly, even in years with powerful returns (like 2013). In comparison, the last mild correction in SPX was nearly 6 months ago.
More significantly, there are several indications that short-term investor sentiment has already become too bearish. Over the past month, individual investors have become as bearish as they typically become after equities have fallen 5-10%. In the past, SPX has normally been near a short-term low when this happens.
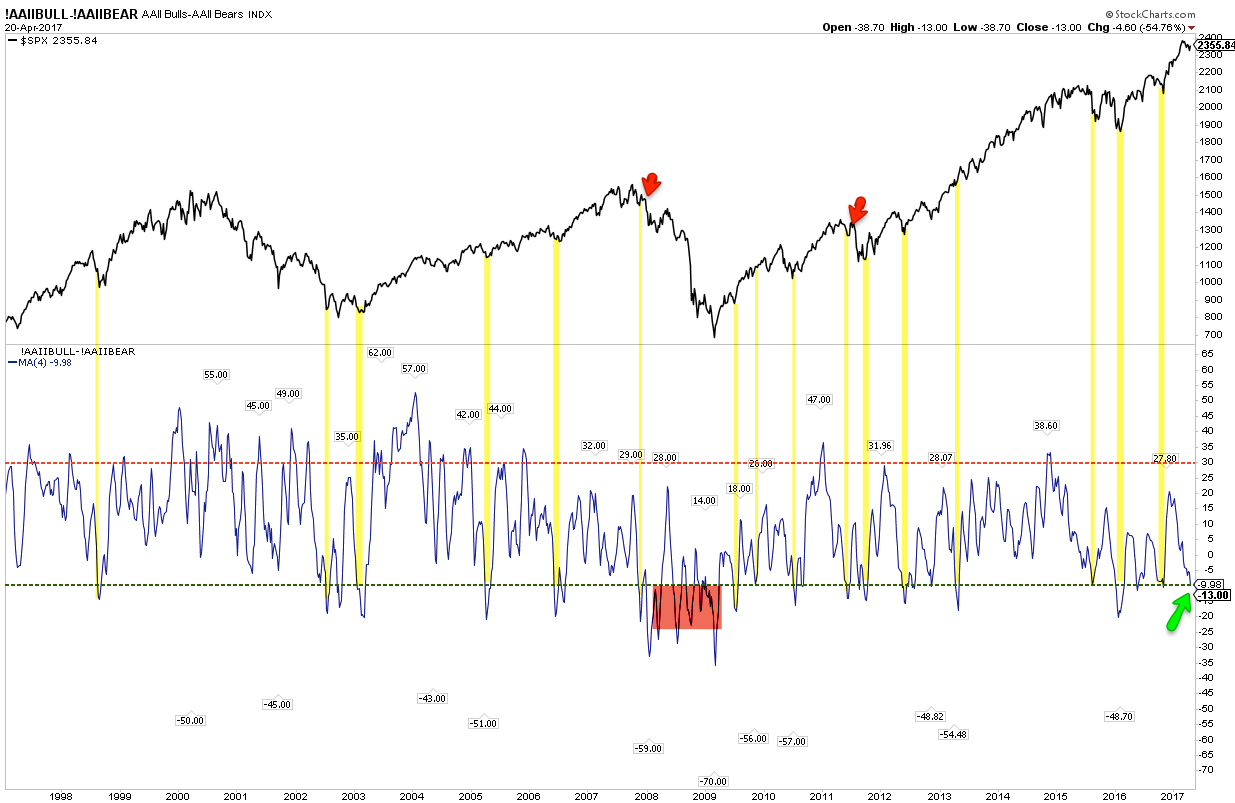
Note that this doesn't preclude a larger correction in the weeks/months ahead (red arrows). Uptrends weaken before they reverse, so a rebound and then a larger break lower would repeat the common sawtooth price pattern found at more significant tops.
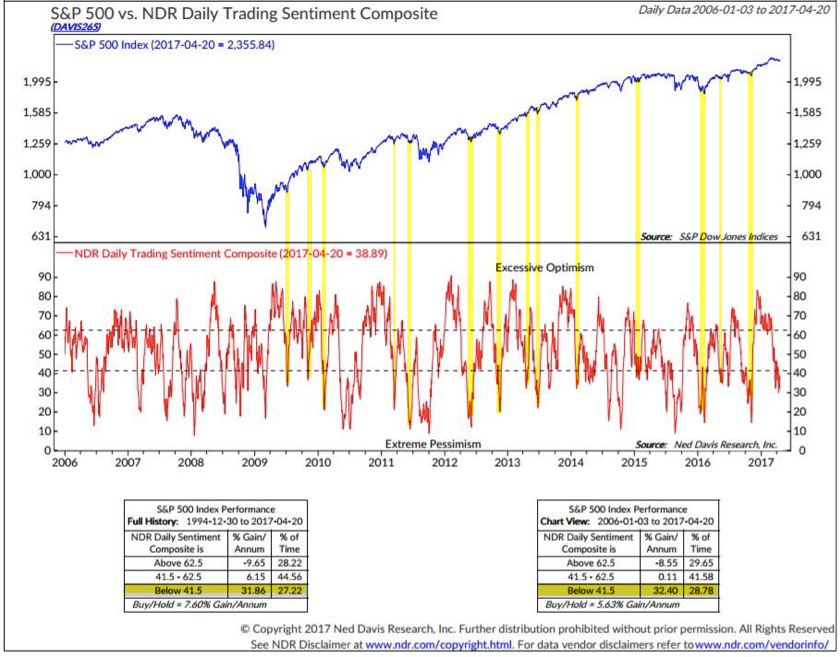
NDR's daily sentiment composite is, similarly, already at a low which usually corresponds with a rebound in price. The tables at the bottom of the chart indicate that forward one-year returns in SPX are strongly positive.
In summary: a week ago, a number of notable short-term extremes in sentiment, breadth and volatility had been reached, suggesting a rebound in equities was ahead. In the event, US equities gained 1% and both NDX and COMPQ made new ATHs.
But new uptrends are marked by indices impulsing higher as investors quickly reposition and chase price. Momentum quickly becomes overbought. Neither of these has happened, at least not yet. Some clarity from the French elections this weekend could free equities to move higher. Should SPX instead rollover, breaking the recent low on April 13 and head to the 2300 area, it's a good guess that a stronger rebound will follow: there are several indications that short-term investor sentiment has already become too bearish.
On the calendar this week: new home sales are on Tuesday, durable goods on Thursday and 1Q GDP on Friday. Congress must pass a stop-gap spending measure by Friday or face a government shutdown.

