Summary: US indices have fallen nearly every day since the FOMC raised the federal funds rate on March 15th. This week, the SPX also experienced its first 1% daily loss in 109 days, bringing one of the longest such streaks in history to an end. There are a number of reasons to expect equities to be at or near a point of reversal higher. A retest of the recent high is likely.
That said, it's a good guess that the market's period of smooth, persistent strength over the past 4-5 months has come to an end. Higher volatility and more days with 1% losses (and 1% gains) lie ahead.
After a strong start to the year, the US indices have turned weak. Since the FOMC raised the Federal Funds Rate on March 15, SPX has closed lower 6 days and higher only once. The 13-ema is now declining, indicating that the intermediate trend is down. There has been no reversal in price, yet, but there are several reasons to believe that a reversal may be near.
On Tuesday, after 109 days, the S&P finally fell more than 1% during one trading day. This was the third longest streak without a 1% loss in the past 36 years.
The charts below look at the 5 prior times since 1980 that SPX went more than 95 days without a 1% fall. It's a small sample but there is a consistent pattern: the index rallies at least 2-5% in the ensuing weeks. Within 2 weeks, SPX was back at its prior high 4 times. The one exception was 1993, which was also the only time that SPX was below its 50-dma; even then, it returned to its high within 2 months. In the other 4 instances, SPX was above its 50-dma, like now. Enlarge any chart by clicking on it.
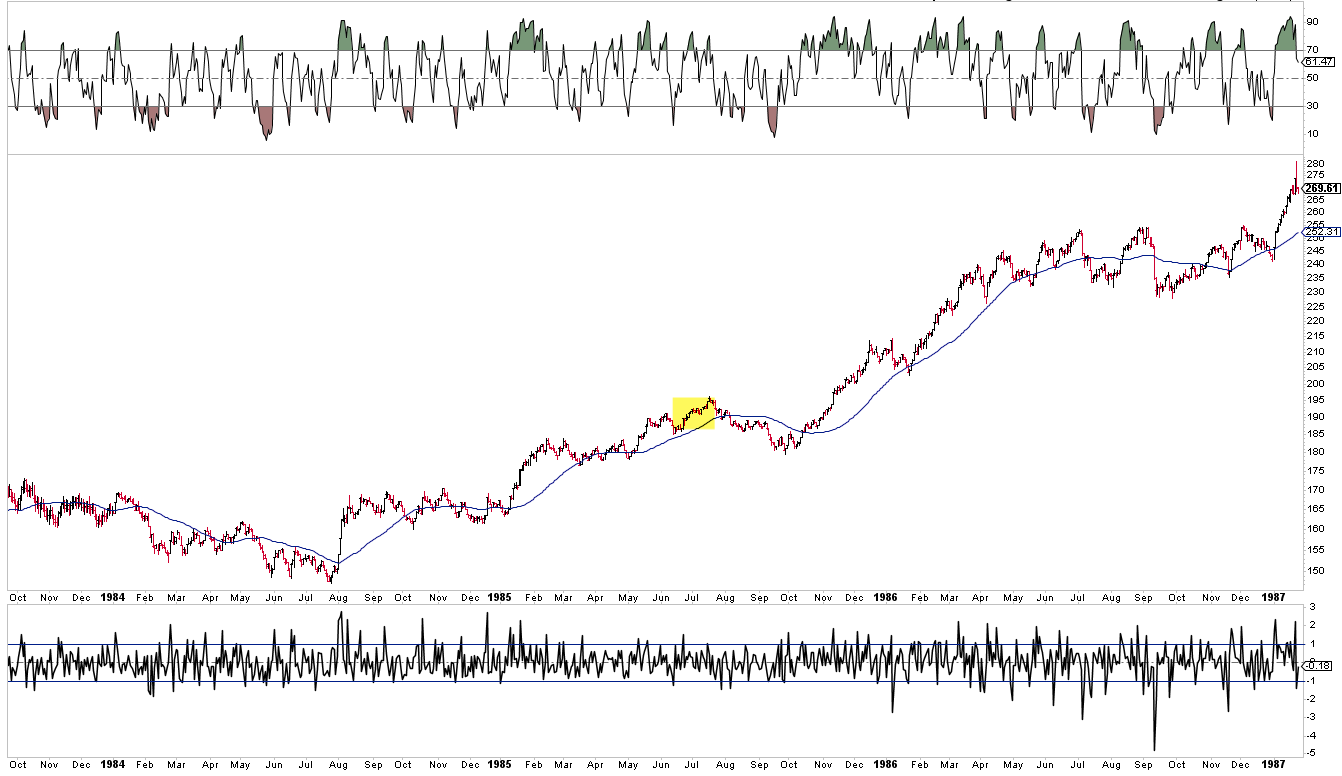
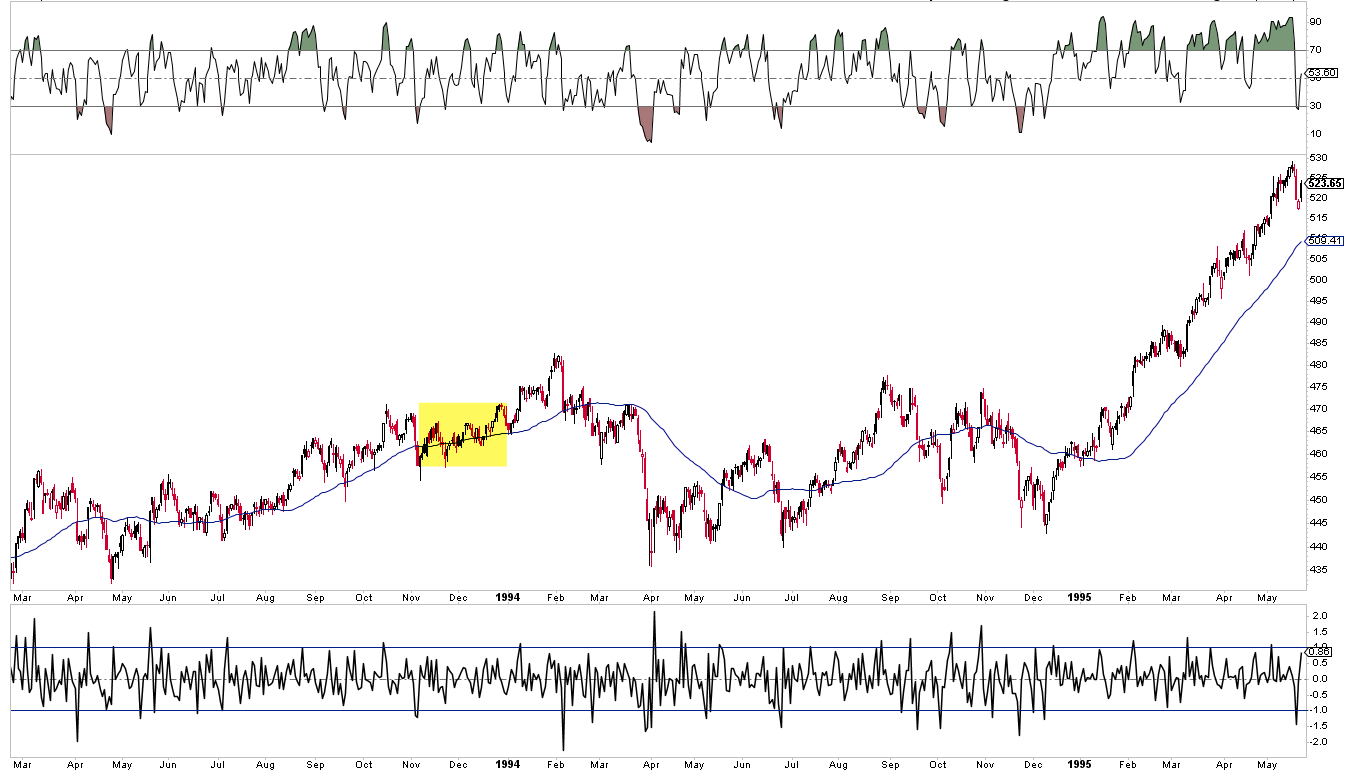
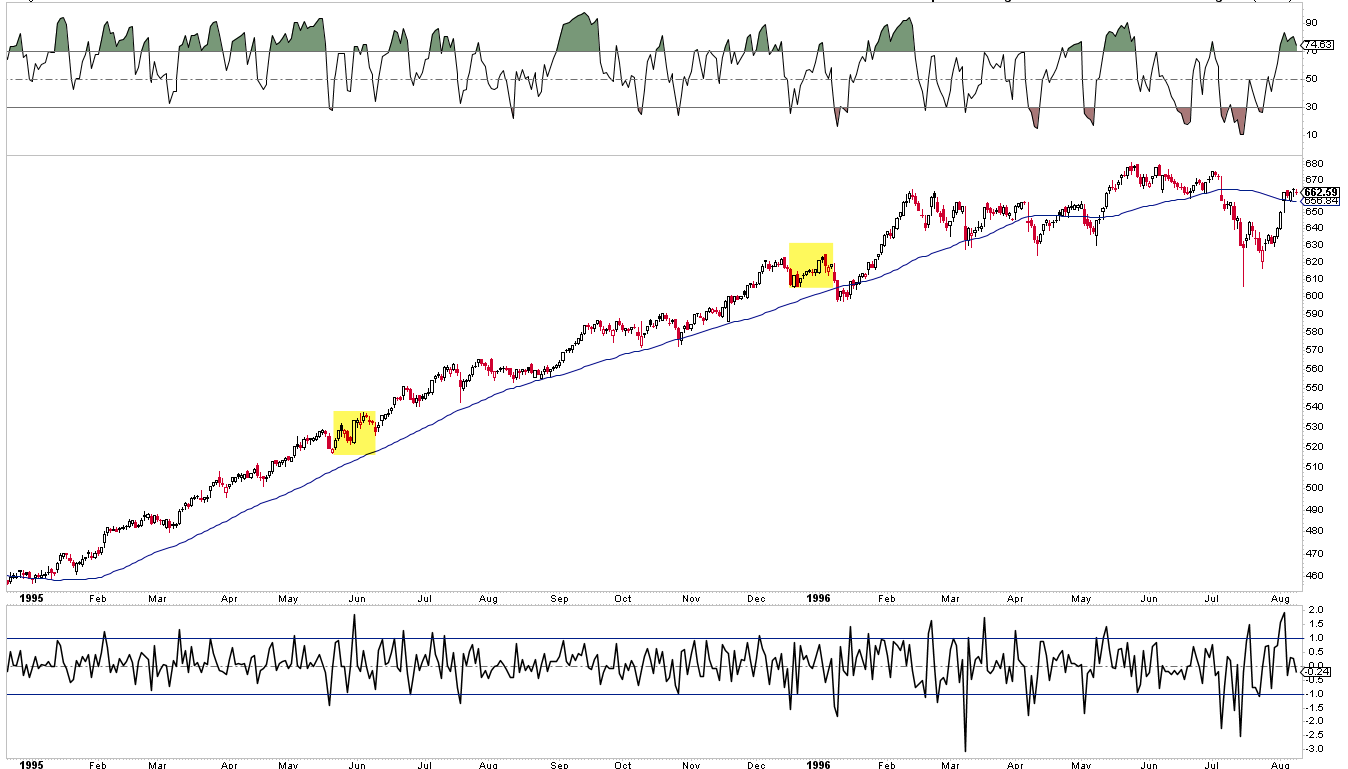
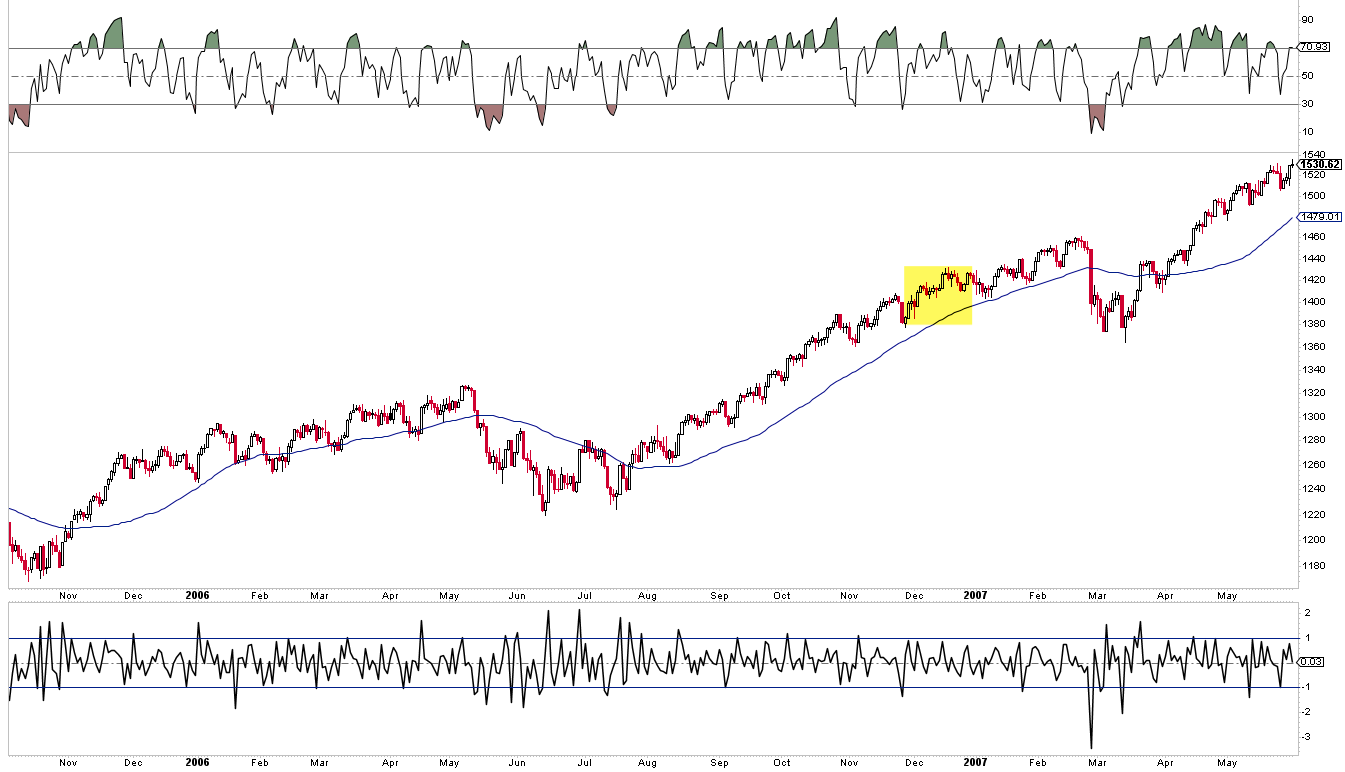
SPX is now less than 3% from its recent high (which was also an ATH). A rally like any of those in the prior 5 instances would put it back at its high.
Going back to 1950, there have been 15 instances where SPX went at least 89 days without a loss of 1% in one day. The pattern is essentially the same as that described above. On average, the index retested its recent high within 4-6 weeks (data from Stock Almanac).
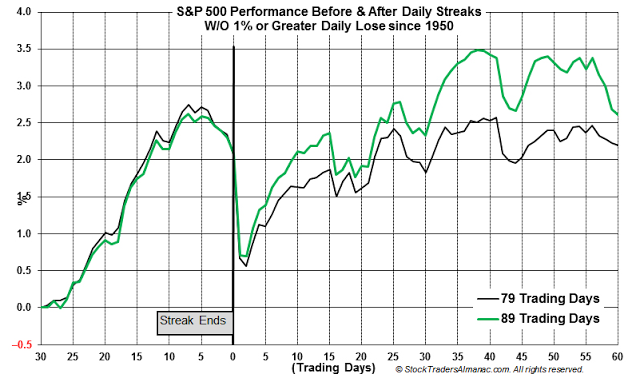
The pattern is not only consistent but logical: a long string of closes without a 1% drop indicates a strong trend. As we have noted many times before, trends tend to weaken before they reverse. In other words, momentum persists. So a high retest within a few weeks would be typical.
A couple of other indications make that likely now as well.
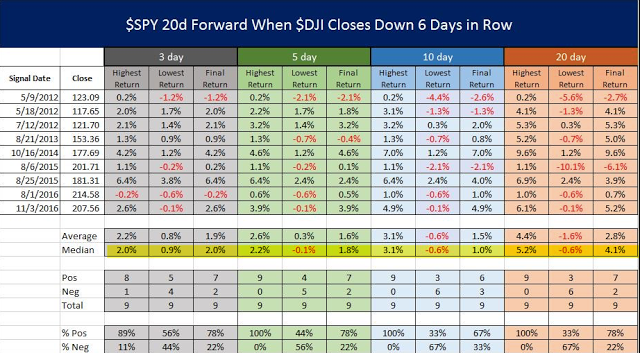
First, the DJIA closed lower 6 days in a row on Thursday. That's an unusual bout of weakness, happening only 9 other times in the past 5 years. In those other instances, the SPX went on to post a return more than 3 times the loss within the next 1-4 weeks (highlighted row). The index closed higher after 5 and 20 days nearly 80% of the time. This suggests a good upside edge heading into this coming week (data from @twillo1).
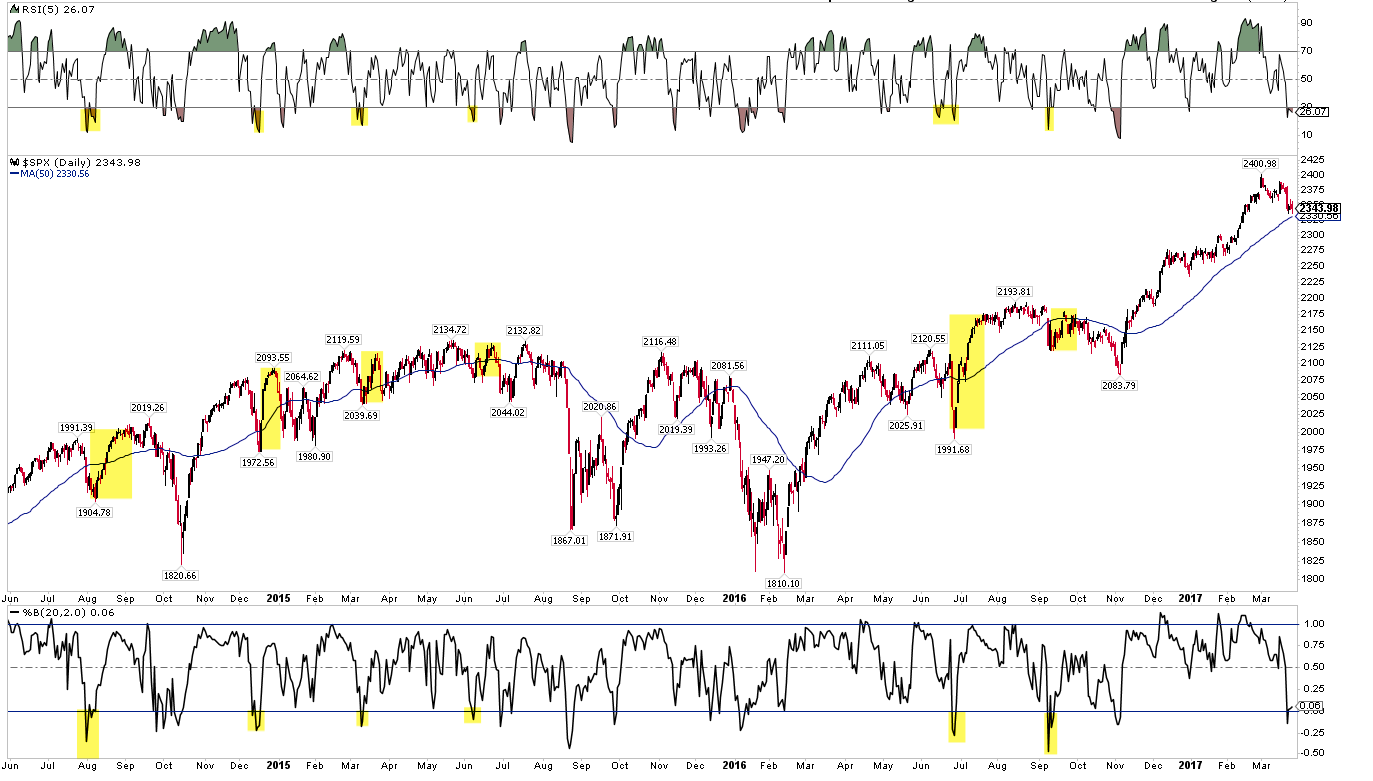
Second, SPX ended the week quite "oversold" as measured by its relative momentum (top panel) and its proximity to its lower Bollinger® Band (lower panel). When this happens together for the first time in an uptrend, it normally leads price higher, even if the bounce ultimately fails. (Context matters: this combination under a flat or falling 50-dma usually leads to lower prices).
Third, SPX ended the week right above its 50-dma. That can often be an approximate area of first support (blue line). On further weakness in the coming week, about 1% lower is the 2300 "round number" support area that was strong resistance for 2 weeks in late January and early February (green line). That would likely be a very significant area to look for a reversal.

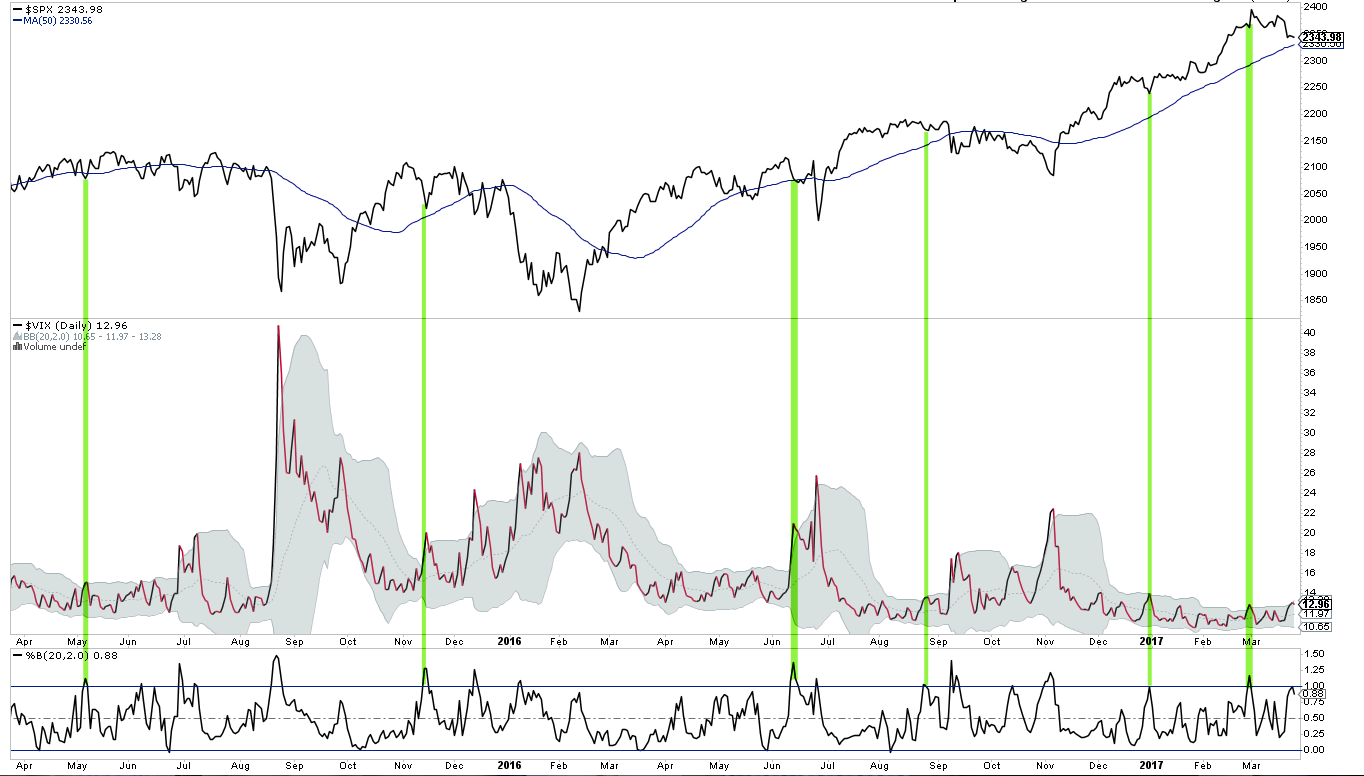
Fourth, the volatility index, VIX, closed near its upper Bollinger on Thursday and Friday. It's near its highest level since the November election. In an uptrend, that is also most often supportive of a reversal higher in the SPX (top panel), even if the bounce ultimately fails.
Finally, the total put/call ratio jumped to its highest close (1.2) since the election on Friday, indicating heightened fear among investors. In the past 3 years there have been more than 50 similar jumps in this ratio: SPX has closed higher within 5 days 92% of the time with an average maximum gain of 1.8%. The 5-day average put/call ratio is also the highest since November: in an uptrend, SPX most often moves higher.
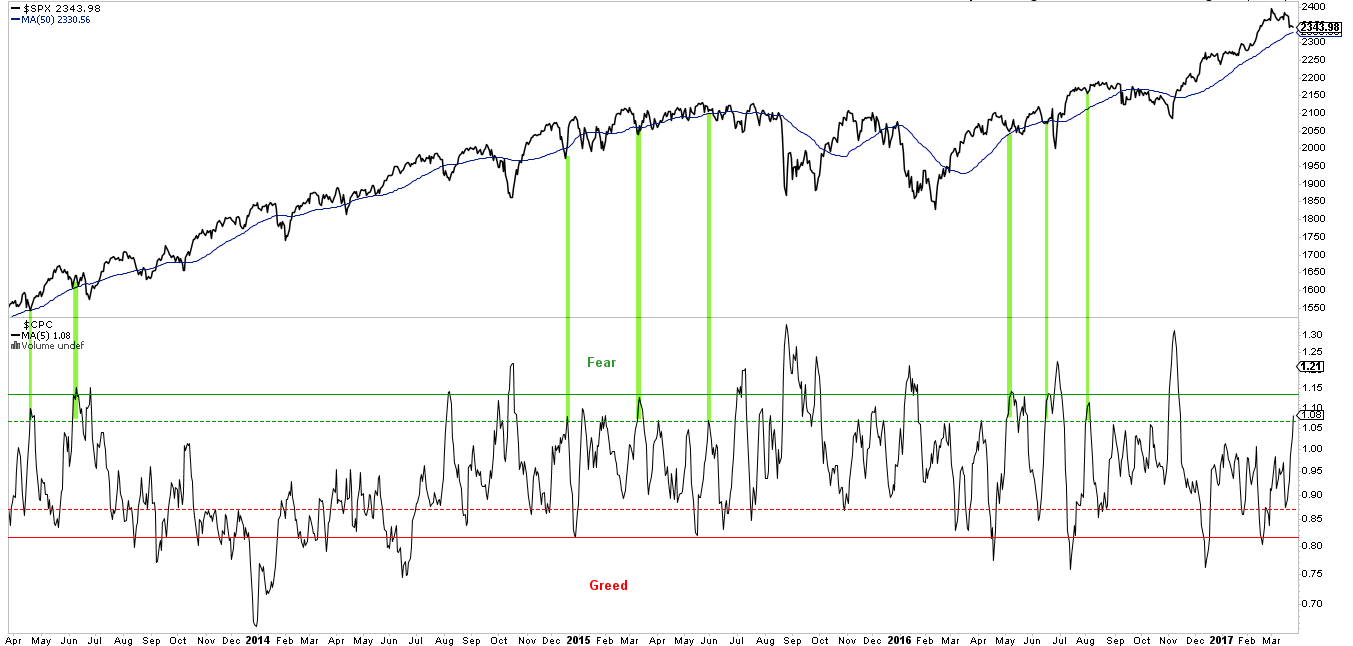
Add to all of this that the upcoming week marks the end of March and the end of the first quarter, and there are a number of reasons to expect the weak intermediate trend to be near a point of reversal.
That said, it's a good guess that the market's period of smooth, persistent strength over the past 4-5 months has come to an end. Even strong uptrends like this one and the one in 2013 eventually succumb to periods of weakness.
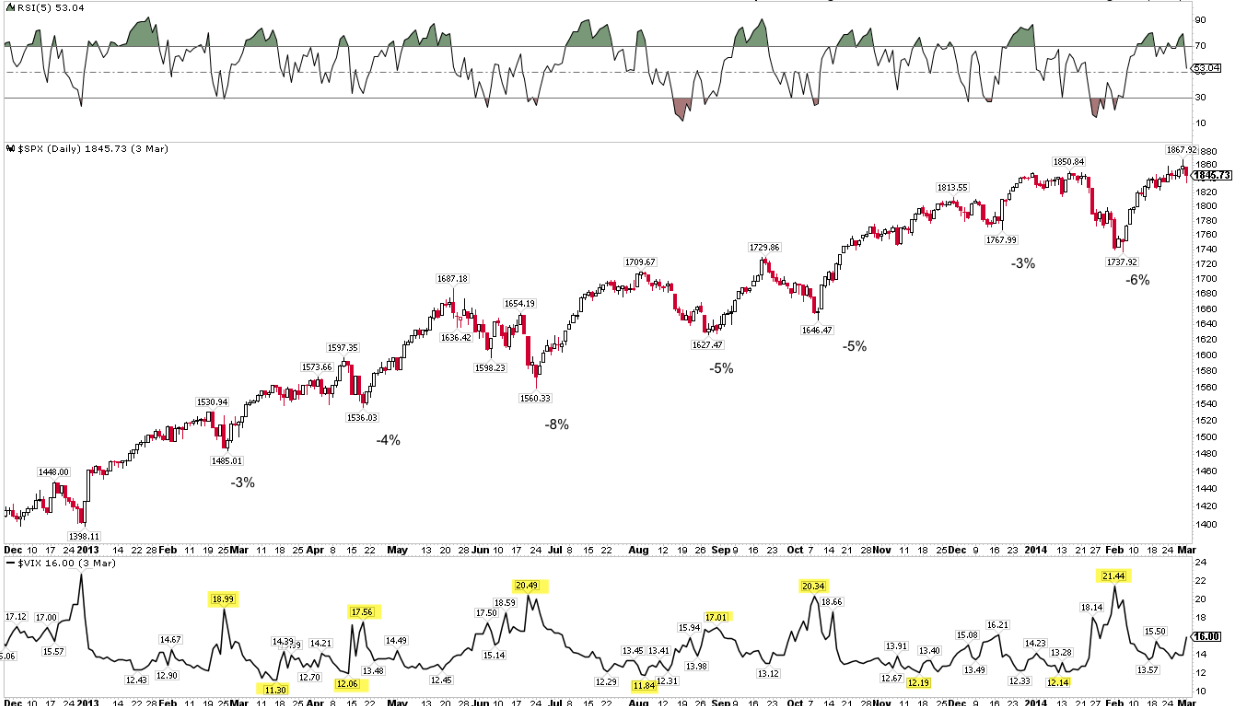
Recall that while SPX gained 30% in 2013, it also fell 3-8% at six different points during the year, usually every other month (% decline indicated on the chart). VIX started 2013 low like it has been so far in 2017 but shot to 17-20 multiple times during the year (lower panel; a full post on this is here).
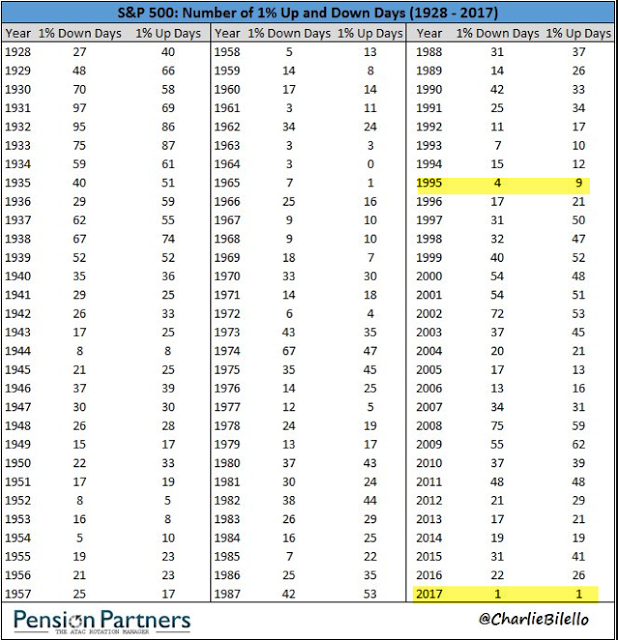
So far in 2017, there has been just one day where SPX gained more than 1% and one day where it lost more than 1%. In the past 30 years, the only year even close to that low level of daily volatility was 1995. It's a good bet that many more weeks like the one that just ended lie ahead (data from Charlie Bilello).
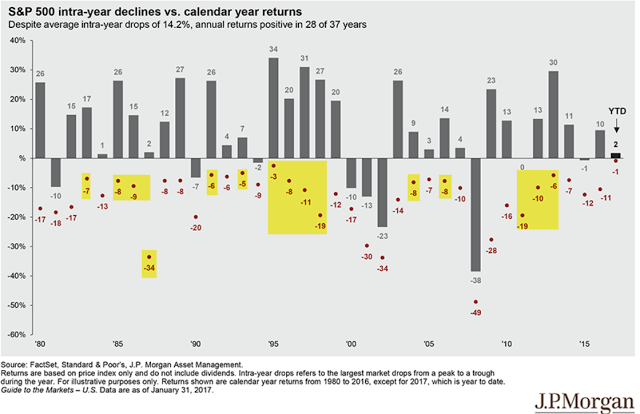
Also, recall that even in the market's best years, an intra-year drawdown of 7-8% is normal. The chart below highlights those years that, like 2017, started with gains in both January and February. The median drawdown was 8%. From the recent high in SPX, an 8% drawdown would return SPX to its early December level of 2200 (data from JPM).
But even if the index now fails to retest the recent high and instead falls further, the uptrend in the markets has most likely not ended.
Recall that SPX has now gone 95 days since the last 3% drawdown, the longest streak since the 150 days between July 2006 to February 2007. The chart below shows the duration and magnitude of the current rally relative to other long streaks in the past 14 years (yellow highlighting equals the current rally).
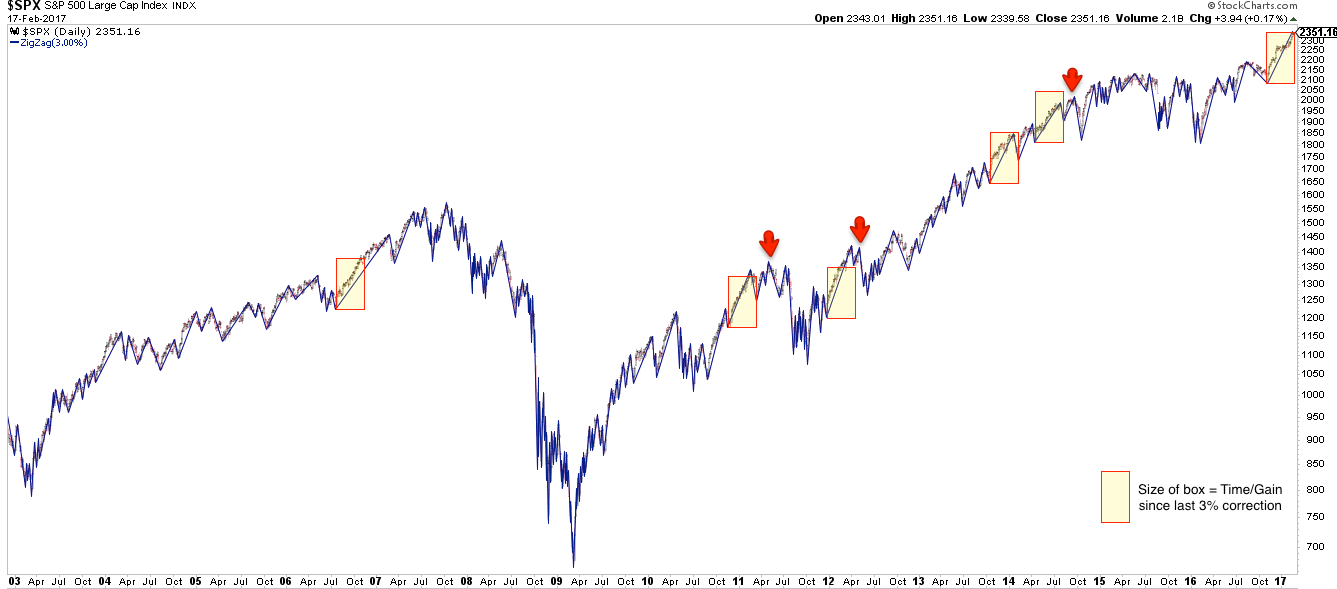
The message: momentum like this weakens before it reverses. In each of the cases highlighted above, after a 3-5% drawdown, SPX either continued higher or retested the prior high before falling lower. Mid-2011, 2012 and 2014 are recent examples of the latter case (arrow marks the high retest that then led to a larger failure).
In summary, US indices have turned weak since the rise in the Federal Funds Rate on March 15th, but there are a number of reasons to expect equities to be at or near a point of reversal higher. A retest of the recent high is likely. That said, it's a good guess that the market's period of smooth, persistent strength over the past 4-5 months has come to an end. Higher volatility and more days with 1% losses (and 1% gains) lie ahead.
On the calendar this week: GDP is reported on Thursday and PCE is reported on Friday, which is also the end of the first quarter.
