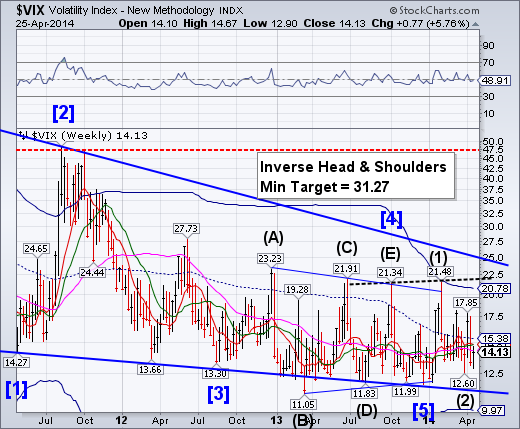
VIX has begun its ascent towards its inverted Head & Shoulders neckline at 22.50. This is the start of the run to the top of the chart that may occur over the next 2 weeks.There is still a sense of complacency that may have been induced by program selling of the VIX.
SPX has a reversal week
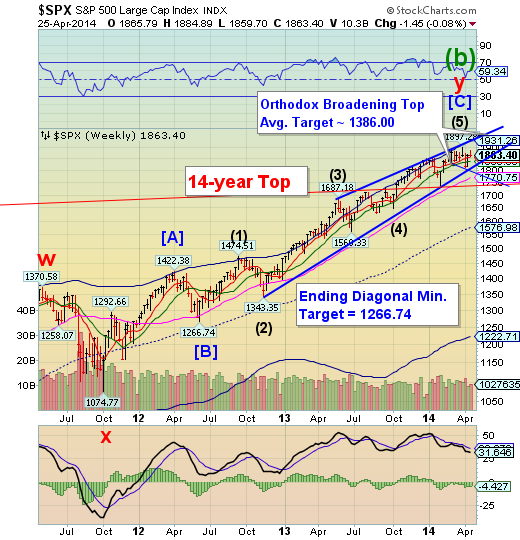
The SPX probed higher early in the week, but made a sharp reversal on Thursday. SPX closed the week in the red.The lower top implies a bearish outcome, since the last reversal in an Orthodox Broadening Top usually is at the upper trendline. The next bounce may occur at 1740.00, its 14-year Top trendline.
ZeroHedge: After a few days of exuberant dead-cat-bounce, that credit and treasury markets largely chose to ignore, Russian headlines sent the USD/JPY (and therefore US equities) dumping hard into the red for the week (and the month). Tuesday was the week's big short-squeeze winning day (as one would expect) and then it was all downhill. Away from stocks, the USD ended the week modestly lower (-0.15%).
NDX is repelled by the Ending Diagonal
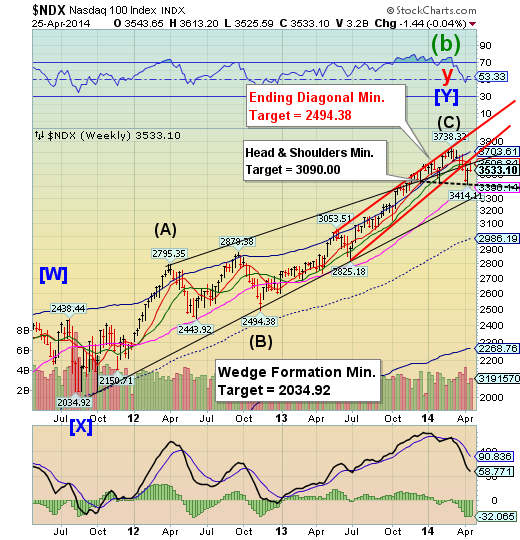
NDX made a dramatic 1-week rally toits Ending Diagonal trendline at 3600.00, but was repelled. It now appears to be preparing to test the Head & Shoulders neckline at 3412.00.NDX is leading the other indexes in a decline as it remains on a seasonal sell signal.
ZeroHedge: Since Fed's Tarullo uttered those ugly words that"valuations are stretched," US growthy momentum stocks have been hammered. The rally of the last few days was met with exuberant BTFWWIII proclamations from various talking-heads as all the problems in the world were fixed and leveraged long high-beta was once again the no-miss trade du jour... until today...
The Eurocompletes a second “inside” week
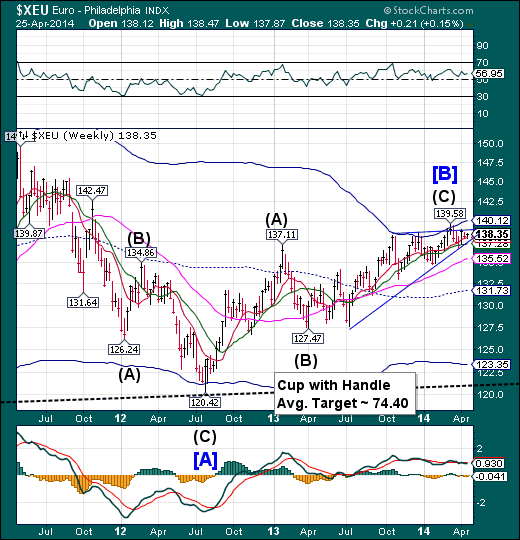
The euro completed a second “inside” week within its Ending Diagonal.The lower trendline of the Ending Diagonal is important, since a decline beneath it may imply a further decline to the July 2012 low.A break of the trendline signals that the decline back to the Lip of its Cup with Handle formation at 121.00 has begun.
Reuters: Euro zone finance ministers will discuss the euro's exchange rate and its economic impact on May 5, but the exchange rate is near its long-term equilibrium and the discussion is unlikely to grow contentious, a senior EU official said on Friday.
The European Central Bank, whose representative will take part in the ministerial discussions on May 5, said earlier in April that the strengthening of the euro exchange rate was an important factor behind the sharp slowdown in inflation.
The bank also said that if the euro appreciated further, the ECB would respond with monetary policy, to keep the overall policy bias unchanged.
EuroStoxx may have completed a reversal pattern
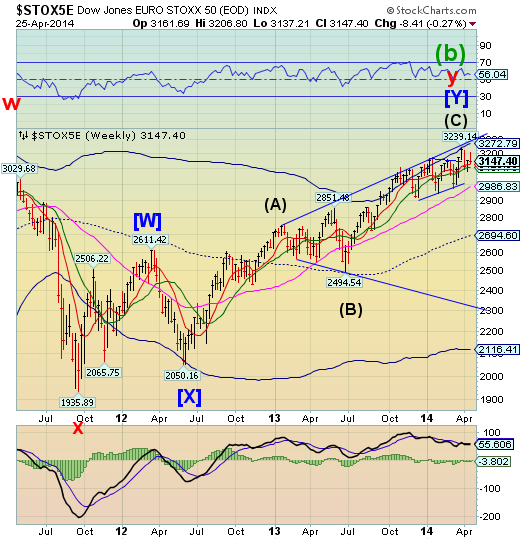
The EuroStoxx 50 index appears to have completed a reversal pattern after retracing 79% of its decline. Failing to make a new high makes the new Cycle left-translated and bearish.
WSJ: U.S. and European leaders Friday struggled to overcome divisions over how to expand sanctions against Russia, a delay that Ukraine complained has emboldened Moscow to continue fanning separatist sentiment in the country's east.
President Barack Obama spoke Friday with leaders of the U.K., France, Germany and Italy to stress the need for concerted measures, and they agreed on the need for action. But the day passed without any announcement.
U.S. and European officials said they have identified areas of greater common ground and suggested new sanctions against Moscow are set to come on Monday.
The Yen also has an “inside” week
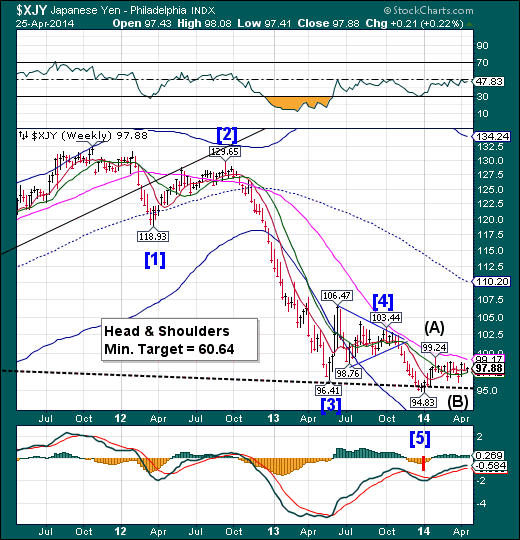
The yen remained within its tight cluster of support and resistance. This implies a market not yet ready to move one way or the other. In the meantime, it affects the liquidity needed by the world equity marketsto continue their rally. Should traders view the yen as a safe haven during political turmoil, the money flow may reverse course and move from stocks to currencies like the yen.
Reuters: Investors moved to the safety of the yen and Swiss franc on Friday, unnerved by escalating tensions between the West and Russia over Ukraine, and also took advantage of higher yielding Pacific currencies.
Mixed U.S. data in recent weeks has left investors without a clear trend, which is now being trumped by the geopolitical concerns in Europe, a combination that has made placing big bets on currency movements high risk endeavors.
The Nikkeiis still above its Head & Shoulders neckline
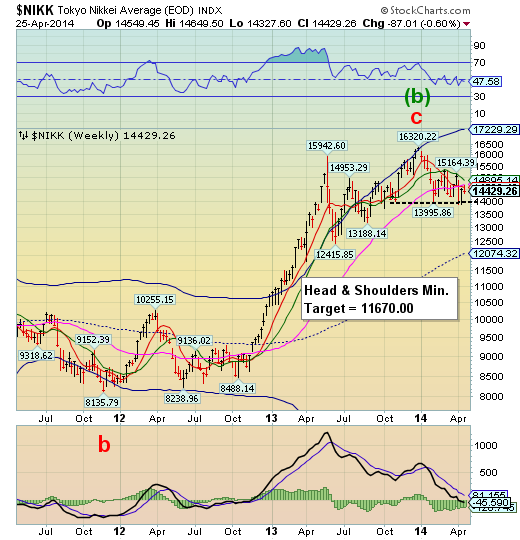
The Nikkei declined beneath all of its potential supports except the neckline of its Head & Shoulders formation on Friday.Lower highs and lower lows are an indication that liquidity is exiting the markets. A rally in the Yen may accompany a further decline in the Nikkei.
GlobalEconomicAnalysis: Japan's CPI spiked to 2.7% this month. What's more interesting is how it was reported in various places.
The Wall Street Journal reports Japan CPI Rises Less Than Expected.
A closely watched Japanese inflation gauge rose a bit less than expected in April, the government said Friday, creating room for possible doubts among Bank of Japan 8301.TO +0.81% policy makers that the recent increase in the domestic sales tax would stoke strong upward price movements.
The ZeroHedge headline reads: Tokyo CPI Spikes To Highest Since 1992 (Well Above Abe's 2% Target)
Which is more accurate?
U.S. Dollar is still near its Cyclical lows.
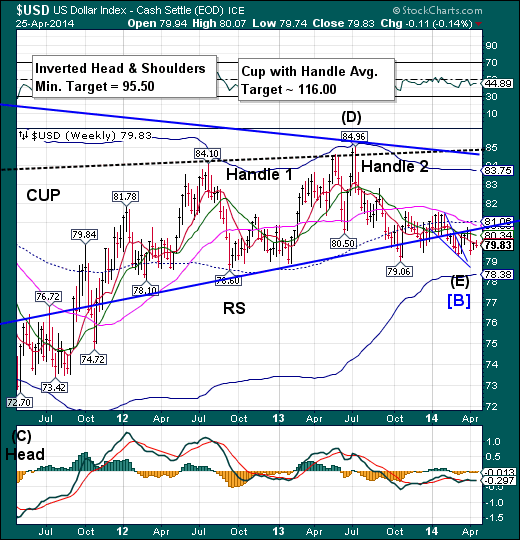
The dollar continues to tarry near its lows. It has made an early half-Trading Cycle low on April 10. The significance of this may be a full trading Cycle may result in a rally lasting up to two months.A challenge of, or a breakout above, mid-Cycle resistance at 81.06 will confirm a probable new uptrend.
CNBC: Investors moved to the safety of the yen and Swiss franc on Friday, unnerved by escalating tensions between the West and Russia over Ukraine, and also took advantage of higher yielding Pacific currencies.
Mixed U.S. data in recent weeks has left investors without a clear trend, which is now being trumped by the geopolitical concerns in Europe, a combination that has made placing big bets on currency movements high risk endeavors.
Treasuries at the end of a retracement?
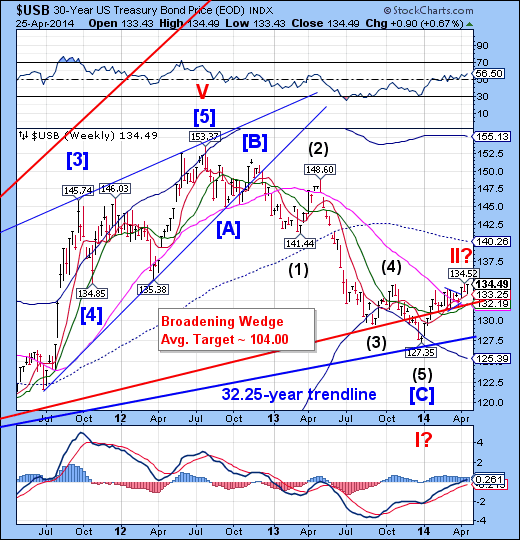
Treasuries appear to be near the end of a 27% retracement of its initial decline from the all-time high. It may take another day or two to reach daily resistance near 135.00 (not shown). There is a Trading Cycle pivot expected on Wednesday. In addition, USB has a date with a major Cycle bottom near the end of May.
ZeroHedge: In the last few months, the yield curve spread between 5Y Treasuries and 30Y has collapsed almost 80bps - this is the fastest relative drop since February 2007. The yield curve is down further today - at its flattest since September 2009. As BofAML'sMacneil Curry warns, the flattening trend is ongoing and sees medium-term targets down to 143bps (over 30bps below current levels) which would raise a number of eyebrows among the exuberant equity crowd (and the Spanish bond-buyers).
Gold is making a second attempt at resistance
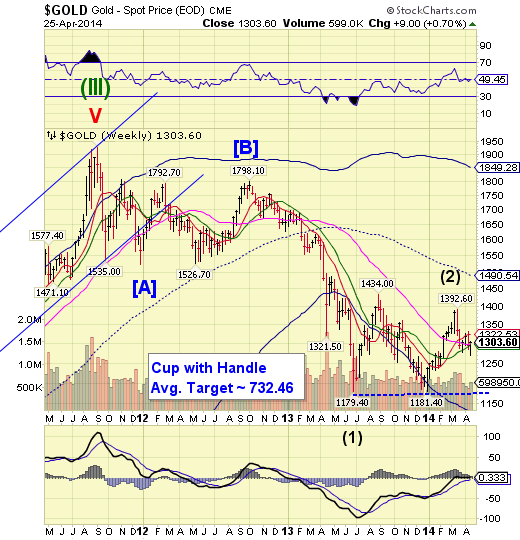
Gold made a deeper low, but managed to bounce again toward Short-term resistance at 1322.53.Unfortunately, the bounce is running out of time. It appears that the decline may impose itself again early next week, whether gold makes its target or not.
WSJ: Gold prices rose above $1,300 a troy ounce for the first time in more than a week as Russian troop movements near Ukraine's border heightened investors' concerns about the conflict.
It was the third session of gains in a row. Gold for April delivery ended $10.20, or 0.8%, higher at $1,300.70 a troy ounce, the highest close since April 16, on the Comex division of the New York Mercantile Exchange. The more actively traded June contract also rose $10.20, or 0.8%, to finish at $1,300.80 a troy ounce.
Crude rally fails to deliver, reverses
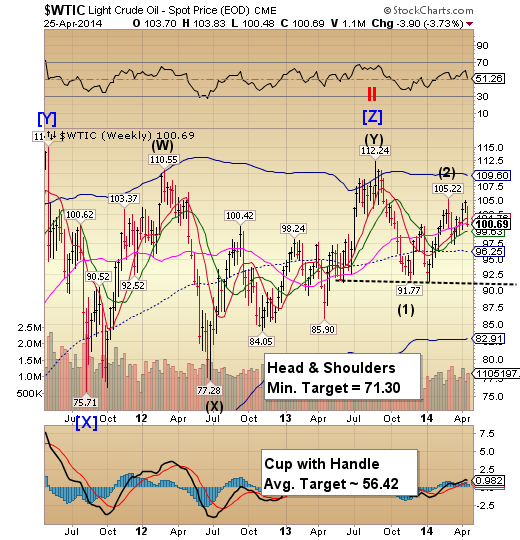
Crude has been edging higher, but fell short of making a new high by .23 at 104.99 last week.It also created a left-translated Trading Cycle, which is bearish, as suggested two weeks ago.A subsequent decline may lead to the Head & Shoulders formation at the base of this rally, which may be overshadowed by the Cup with Handle formation with an even deeper target.
FoxNews: The price of oil declined below $101 per barrel after disappointing earnings in the U.S. on Friday, having earlier risen on worries about the tensions in Ukraine.
Benchmark U.S. crude for June delivery shed $1.07 to $100.87 on the New York Mercantile Exchange. Brent crude, an international benchmark for oil, gave up 27 cents to $110.06 on the ICE Futures exchange in London a day after gaining $1.22.
China falls back below all supports
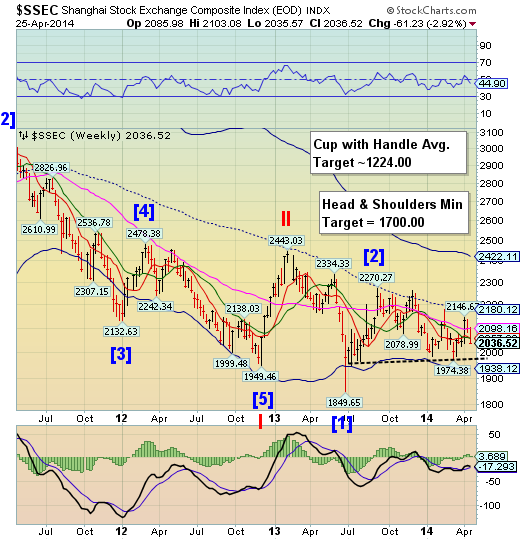
The Shanghai Index fellbelow its Model support levels, losing two-thirds of its gains off the neckline of its Head & Shoulders formation. The new Trading Cycle is also left-translated and bearish. The ensuing decline may be swift and deep. There is no support beneath its Cycle Bottom at 1938.12.
ZeroHedge: It may come as a surprise to many, if certainly not the country known as Gazpromia, that according to a government statement released on Wednesday, China will raise its natural gas supply to a whopping 420 billion cubic meters per year by 2020 on soaring demand due to urbanization, a government statement said on Wednesday. This compares roughly 168 bcm in gas used in 2013, which means somehow China hopes to boost gas production by over 150% in just 6 years.
The increased supply will cater to the rising demand for natural gas in people's daily lives, schools, nursing homes, home heating, as well as in buses and taxis, according to a statement published on the central government's website.
The Banking Indexunable to regain support
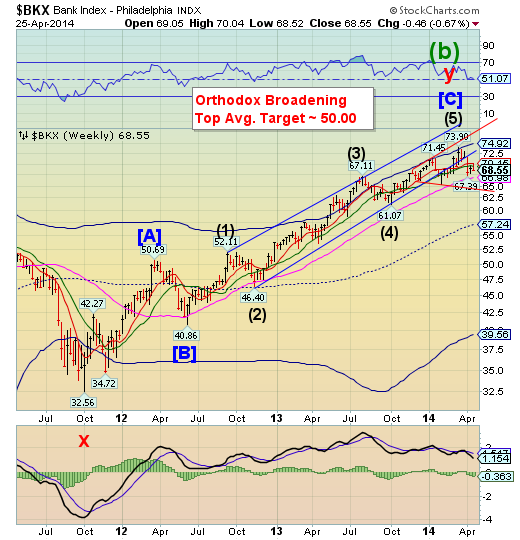
After rallying two weeks, BKXresumed its decline to Long-term support at 66.95. The next target is below its Orthodox Broadening formation near 62.75.A bounce from beneath the Broadening Top may heighten the probability of a flash crash soon after.
ZeroHedge: Andrew Haldane, who is well known among readers as being one of the most outspoken and truthy central bankers in the world, will become Bank of England's Chief Economist in June. That fact is what makes his comments - however factually honest - extremely uncomfortable for the Keynesian status quo DSGE modelers alive and well in every central bank in the world. To summarize his thoughts in the following letter - the models are useless and it's time to rethink everything...
Reuters: Russia's third biggest bank moved almost $7 billion to the central bank as tension over Ukraine rose in March and joined others in slashing its deposits in foreign banks where they could be frozen if more international sanctions are imposed.
The movement of funds by Gazprombank, revealed in data published by the central bank, means that at the beginning of April its foreign currency on deposit at the central bank dwarfed those of other major Russian banks.
It was "quite a unique event", Maxim Osadchy, banking analyst at Moscow-based BKF Bank, said, notingGazprombank hardly ever used that account for foreign currency operations."This could show that Gazprombank was using the foreign currency correspondent account at the central bank as a sort of haven from sanctions."
DealBook: The Justice Department, building on a multibillion-dollar mortgage settlement with JP Morgan Chase last year, is now aiming for a deal with Bank of America.
In a move that raised the stakes for the government’s crackdown on banks that sold the troubled mortgage investments during the financial crisis, the Justice Department made Bank of America an opening settlement offer of roughly $20 billion several weeks ago, according to people briefed on the matter.
ZeroHedge: Earlier today, the Central Bank of Russia announced that starting April 21, it would revoke the license of Moscow’s Bank Zapadny. According to reports, "the bank had cooked its books and failed to comply with regulations on the amount of assets a financial organization must maintain to ensure its stability, the central bank said." In other words, your typical FDIC Failure Friday only on Monday morning. Hardly notable. It is what happened next that was shocking. Shortly after the bank shutdown announcement, an armed man took three hostages at a Belgorod branch of precisely this failed Bank Zapadny.
A withdrawal at gunpoint?
Disclaimer: Nothing in this email should be construed as a personal recommendation to buy, hold or sell short any security. The Practical Investor, LLC (TPI) may provide a status report of certain indexes or their proxies using a proprietary model. At no time shall a reader be justified in inferring that personal investment advice is intended. Investing carries certain risks of losses and leveraged products and futures may be especially volatile. Information provided by TPI is expressed in good faith, but is not guaranteed. A perfect market service does not exist. Long-term success in the market demands recognition that error and uncertainty are a part of any effort to assess the probable outcome of any given investment. Please consult your financial advisor to explain all risks before making any investment decision. It is not possible to invest in any index.

