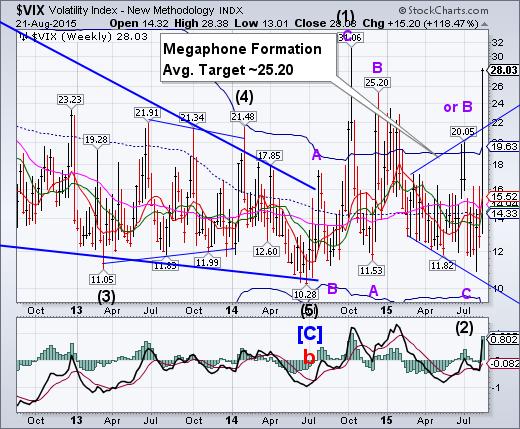
VIX exceeded its Megaphone target by Friday’s close. There is likely to be a pullback to Cycle Top support at 19.63 from here, followed by a stronger rally. Investors finally caught on that they needed to hedge their positions.
SPX “triggers” the Broadening Wedge.
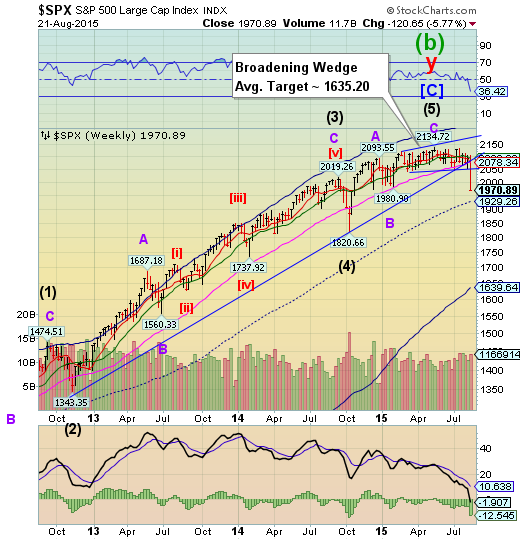
The SPX fell through its Broadening Wedge trendline, triggering a potential move to the weekly Cycle Bottom support at 1639.64.The amazing thing is that, after a possible bounce on Monday, that target may be attainable in very short order. In other words, next week’s decline has the potential of becoming much worse.
(ZeroHedge) To think it only took an unprecedented surge in volatility as the market suddenly realized that central banks are losing control in a world where secular stagnation is a direct function of 7 years of failed central bank policy, to get the banks out of permabullish hibernation and to slam the "sell everything" alert.
Dow Theory flashes sell signal. S&P 500, NYSE and Russell 2000 all closed below key supports.
No tactical capitulation. Not 90% down. ARMS below 2.0. 10-day total put/call ratio not showing panic. But VXV/VIX oversold.
NDX crashes through final supports.
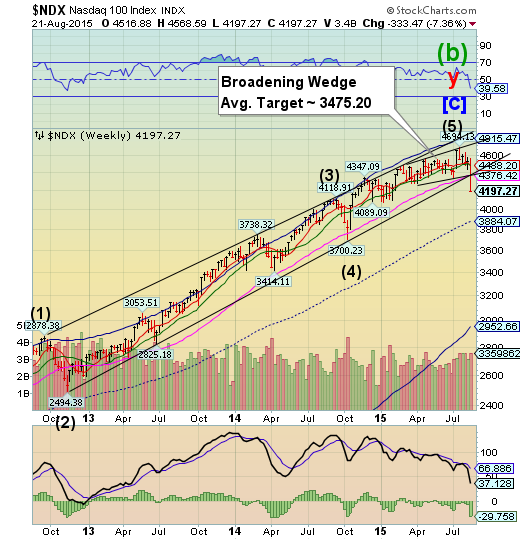
NDX violated weekly Long-term support at 4376.42, the Broadening Wedge and its 3-year trendline today. NDX has no technical supports until it reaches its October 2015 low. Investors may have only a short window of opportunity to exit before the door slams shut.
(ZeroHedge) Following the biggest 4-day decline in NASDAQ:AAPL stock since Jan 2014, the "no brainer" once-darling of the investing world has just officially entered a bear market, down 20% from its April record highs.
The break below $107.63 brings AAPL into a bear market...
For the biggest 4-day drop since Jan 2014...
High Yield Bonds break below the Broadening Wedge.
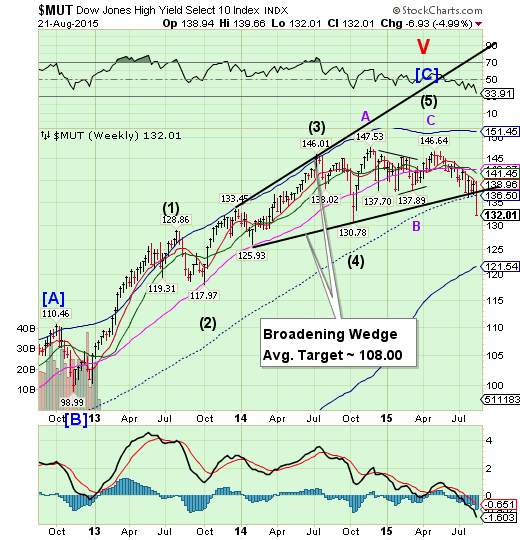
The High Yield Index broke through the lower trendline of its Broadening Wedge formation and mid-Cycle support at 136.50. It appears that Cycle Bottom support at 121.54 may be the next target, although the Broadening Wedge target may take precedence. The financing of stock buybacks is being seriously threatened by the outflows indicated in the chart.
(MarketRealist) Investor flows in high yield bond funds were negative last week for the third consecutive week, following three successive weeks of inflows. According to Lipper, net outflows from high yield bond funds totaled $1.2 billion in the week ended August 12, the same as in the previous week. Due to these sharp outflows, high yield bond funds have witnessed outflows totaling $2.5 billion on a year-to-date basis
The euro challenges Long-term resistance.
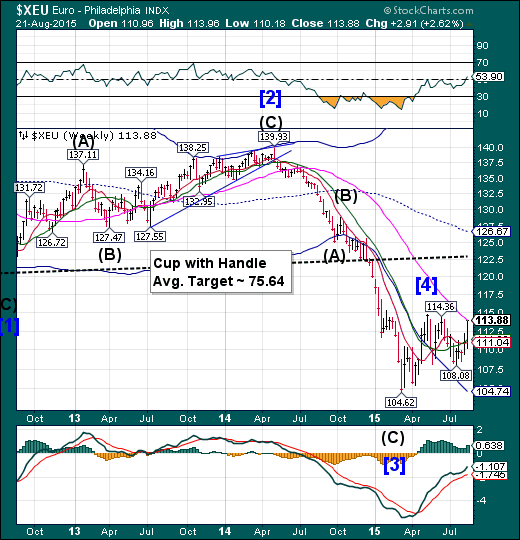
The euro closed the week just shy of Long-term resistance at 113.99. The surge in the euro was primarily due to the demand for the local currency as European stocks were sold. There is the potential that the euro may go higher in the next week.
EuroStoxx breaks an important support.
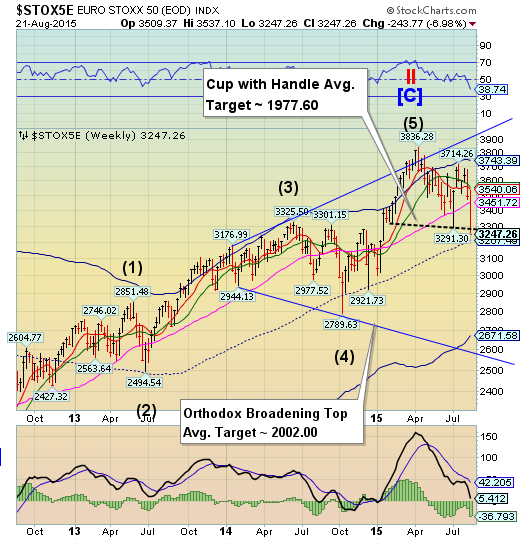
EuroStoxx 50 fell beneath the lip of its Cup with Handle formation, triggering a decline that could potentially wipe out three years of gain. The Cycles Model suggests weakness through the end of August. One can forget about how oversold an index is in a panic decline.
(Reuters) - European shares suffered their worst one-day fall in nearly four years on Friday as growing concerns over China's economy hit world markets.
Many investors said they were nervous about the near-term outlook.
The pan-European FTSEurofirst 300 index closed down 3.40 percent at 1,427.13 points.
The index fell to its lowest level since January and had its worst one-day drop since a 3.44 percent slump in November 2011. It also posted its worst weekly decline since August 2011.
The euro zone's blue-chip Euro STOXX 50 index fell 3.2 percent. Germany's DAX dropped 3 percent, with the DAX nearly 20 percent below record highs reached in April.
The yen climbs off its bottom.
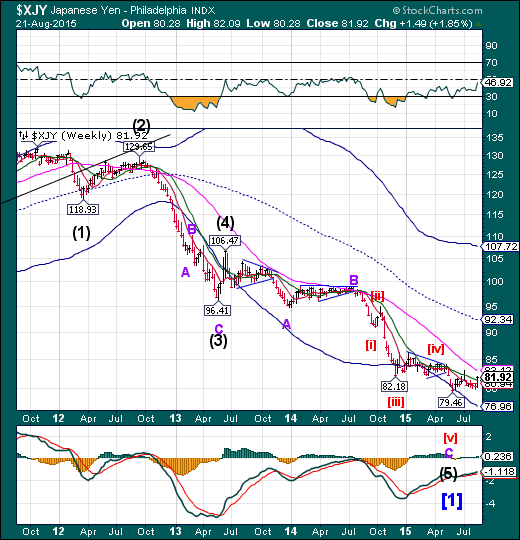
The yen rallied, closing above weekly Intermediate-term support at 81.39. Once above Long-term support/resistance, it may emerge to challenge its Cycle Top at 107.72 through the balance of August and September. A breakout above its prior high at 83.05 or Long-term resistance at 83.12 may prove to be actionable signals, as a rally in the yen is evidence of an unwind of the yen carry trade due to falling equities.
The Nikkei declines to its Broadening Wedge trendline.
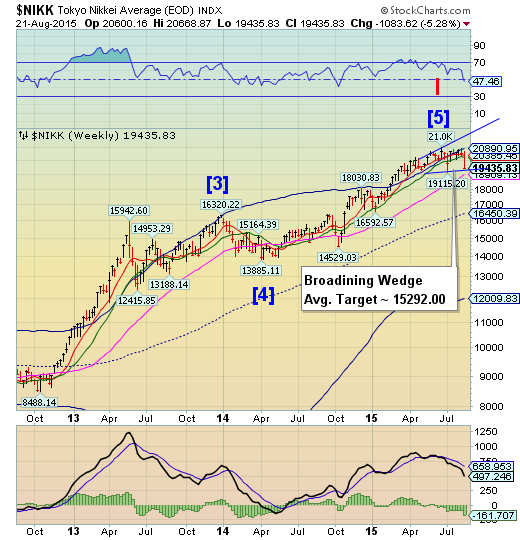
Since the June 24 high, the Nikkei has been repelled by its Cycle Top resistance. This week it reversed down to challenge (or trigger) its Broadening Wedge formation. A break of that support may trigger a severe decline lasting for a week or more.
(Reuters) - Japan's Nikkei share average dropped more than 2 percent to six-week lows on Friday morning after Wall Street tumbled as investors unloaded risky assets, hit by concerns that a slowdown in China could affect the global economy.
The Nikkei share average fell 2.2 percent to 19,594.13 in midmorning trade, the lowest level since July 9. The index has fallen for a fourth day, and for the week, shedding 4.6 percent so far.
"Due to uncertainly about where China's economy is going, what Beijing will do (in terms of monetary policy) and how much the impact it will have on the global market, anything related to China worries is sold," said Takuya Takahashi, a strategist at Daiwa Securities.
U.S. dollar breaks through Model supports.
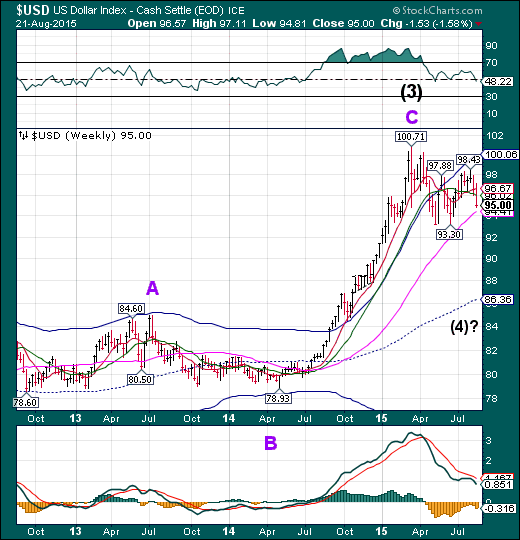
The US dollar broke through Intermediate-term support at 96.02 in a retracement decline that may have deeper legs. A break of Long-term support at 94.41 may precipitate a further decline as far as weekly mid-Cycle support at 86.36. The Cycle Model then suggests the rally may emerge, pushing the USD higher through mid-September.
(Bloomberg) Dollar bulls are having a reality-check moment as the Federal Reserve keeps traders guessing about when it will raise interest rates.
Currencies of economies with the lowest borrowing costs, including the euro and the yen, rallied against the dollar as bets waned that the Fed will increase its benchmark rate in September. That pushed the greenback to its biggest weekly loss in two months, after minutes of the Fed’s July meeting showed policy makers unconvinced that conditions for a rate increase have been met.
USB continues the rally.
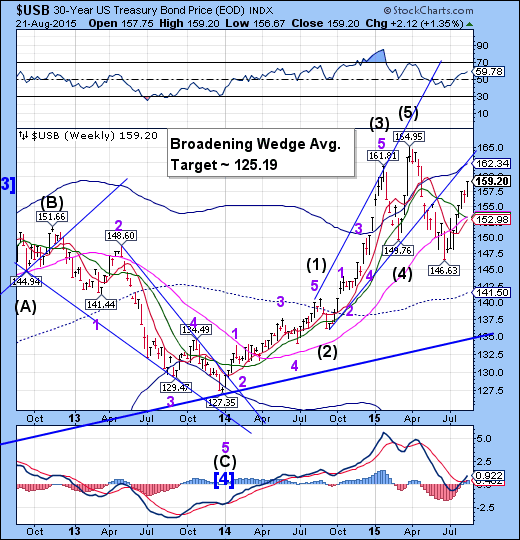
The Long Bond continues to rally, fueled by investors’ flight to a perceived haven. It appears that an important Cycle pivot point is due early next week that may affect the outlook for bonds.
(WSJ) Plunging global stocks and crude oil prices on Friday sent investors into the safe harbor of U.S. government bonds, pushing down the yield on the benchmark 10-year note closer to the 2% mark.
The yield on the benchmark 10-year note fell to 2.052% in late-afternoon trading from 2.084% on Thursday. The yield closed at the lowest level since April—the month when the yield last traded below 2%.
Gold may rally higher.
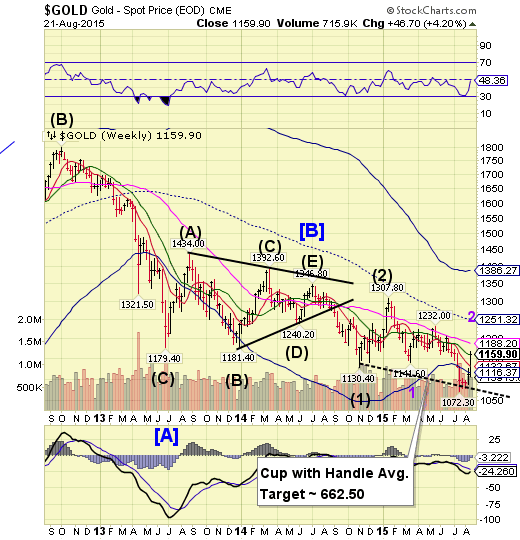
Gold closed short of its Intermediate-term resistance at 1160.56, but may continue its rally for another week. This does not negate the downtrend. Counter-trend bounces, known as dead cat bounces, can be rather sharp. The next immediate target for the rally may be Long-term resistance at 1188.20, but failure to overcome Intermediate-term resistance may end the rally sooner.
(WSJ) Gold prices rose on Friday, closing at their highest level in seven weeks, as some investors sought to shield their wealth from turbulence in global stocks and currency markets.
The most actively traded contract, for December delivery, rose $6.40, or 0.6%, to settle at $1,159.60 a troy ounce on the Comex division of the New York Mercantile Exchange. That was the highest close since July 2.
Gold prices pulled higher in recent days on concerns about a downturn in China’s economy. Investors often buy gold in times of political and economic uncertainty, in the belief it will keep its value better than such assets as stocks, bonds and currencies.
Crude may be due for a bounce.
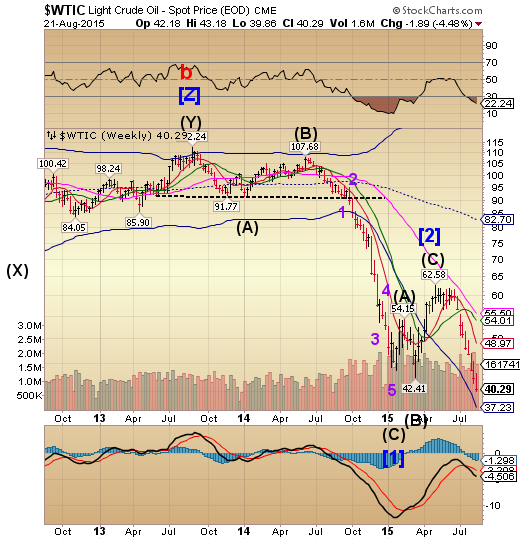
Crude may be due for a bounce next week, if it can hold its new low of 39.86. The decline may be capable of lasting through the end of August, according to the Cycles Model, but a retracement bounce may come at any time next week if the low holds. Traders should stay on the alert.
(BusinessInsider) Crude oil just crashed below $40 per barrel for the first time since 2009.
West Texas Intermediate crude oil futures in New York fell more than 3% to as low as $39.89 per barrel.
On Friday afternoon, data from driller Baker Hughes (NYSE:BHI) showed that the oil rig count climbed by two to 672 — the fifth straight week with a rise. Shortly after the data release, WTI slipped below $40.
The slide toward $40 per barrel gained momentum earlier this week after the US Energy Information Administration reported a larger-than-expected build in crude inventories last week.
Shanghai Index closed below Long-term support.
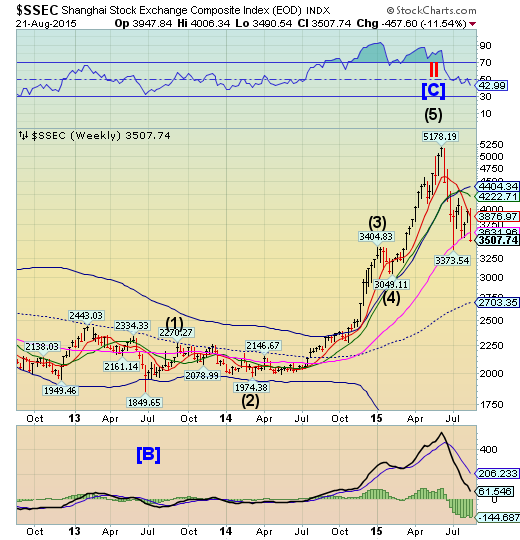
The Shanghai Index closed beneath weekly Long-term support at 3631.06. Last week I commented, “should Long-term support at 3603.92 be broken, a panic decline may ensue.” The index may attempt to retake its Long-term support early next week, but once the potential bounce ends, there is little to stop an even more intense decline.
(Bloomberg) Chinese stock traders put the government’s market rescue to the test, sending the Shanghai Composite Index to within one point of its low during the depths of a $4 trillion selloff last month.
The benchmark index dropped 4.3 percent to 3,507.74, clawing its way above the 3,500 level in the last five minutes of trade. With data Friday showing the manufacturing sector is at the weakest since the global financial crisis, investors are trying to gauge how far state-linked funds will go to prop up share prices. Hong Kong’s Hang Seng Index entered a bear market after dropping more than 20 percent from its April 28 peak.
The Banking Index broke its 3-year trendline.
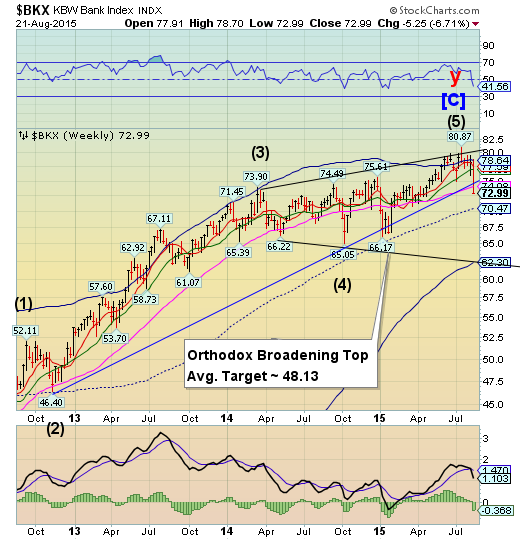
BKX broke its Long-term support at 74.08 and its 3-year Ending Diagonal trendline this week. A loss of Long-term support confirms the potential change in trend that few recognize yet. There may be an attempt to regain that support early next week, but the Cycles Model suggests that the decline may intensify very quickly after only a potential day or so of consolidation.
(Reuters) Puerto Rico's FDIC-insured banks are well capitalized but the Federal Deposit Insurance Corp stands ready to act if one should become insolvent, according to a letter sent to Congressman Sean Duffy, chairman of a Financial Services subcommittee who had inquired about their health.
Puerto Rico's Governor Alejandro Garcia Padilla shocked investors in June when he said the island's debt, totaling $72 billion, was unpayable and required restructuring. The island has been in recession for nearly a decade.
"Our committee has jurisdiction over banks ... and we have been working on the safety and soundness concerns of Puerto Rico banks," said Duffy, who is separately working on a proposal to look for solutions to Puerto Rico's problems with possible ideas including using a financial control board.
(ZeroHedge) "Wealth management products in China have come under the spotlight after a series of missed payments raised concerns over the shadow banking sector that often directs credit to firms shut out from bank lending or capital markets," Reuters said in February, after reporting that CITIC (China's top brokerage), was looking at ways to repay investors after the issuer of one of the wealth management products the broker sold missed a $1.12 million payment to investors.
That news came a little over a year after the now infamous "Credit Equals Gold #1 Collective Trust Product" incident and a subsequent default scare on a similar product backed by loans to a struggling coal company.
(HousingWire) The Federal Deposit Insurance Corporation sued Citigroup (NYSE:C) and US Bancorp (NYSE:USB), along with the Bank of New York Mellon (NYSE:BK), on Wednesday in an attempt to get back more than $695 million that it lost from selling shoddy residential mortgage-backed securities once owned by a failed Texas bank.
HousingWire reported on Wednesday that the FDIC was suing the Bank of New York Mellon, with two other bank names now getting added to that list.
