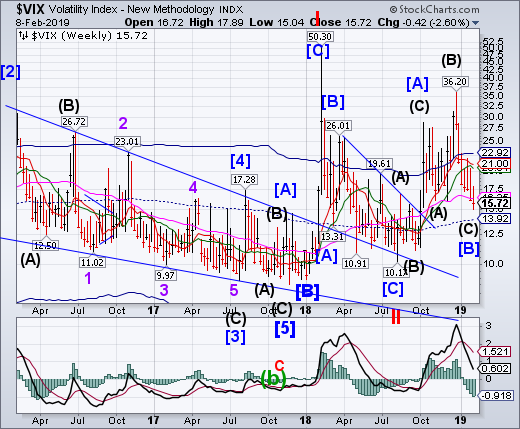
VIX made its Master Cycle low on Tuesday, then began challenging Long-term support/resistance at 16.35. It closed the week below critical resistance, but it appears that Primary Cycle [B] may be over. While investors are heaving a sigh of relief, the Wave structure and Cycles suggest a strong reversal may be imminent.
(TheStreet) Well at least we saw some volatility! And yes I understand that now that we've gotten some volatility folks want to know how high can the VIX go? Spoiler alert: I don't know.
Here's what I do know: I believe the VIX over the next few weeks will be more lively than it's been. I mean it's already backed off a point and a half just through the trading day. But because the overbought condition is of an intermediate term one I simply expect there will be more volatility as we work off that overbought condition. So even if the VIX backs off Friday and/or Monday, I don't expect the volatility is done quite yet.
SPX repelled at Long-term resistance.
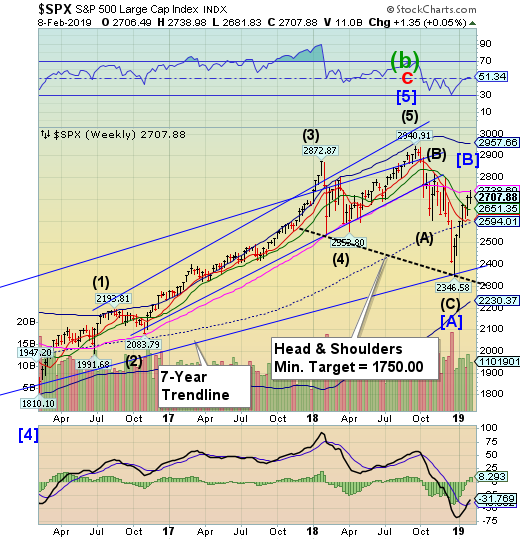
SPX turned back at Long-term resistance at 2738.80 on Tuesday, completing 6 weeks of rally from the Christmas low. At this point it appears that a retest of the December low may take place. There is a probable Head & Shoulders neckline that, if reached in the next few weeks, may indicate the target of this decline.
(Bloomberg) U.S. stocks ended virtually unchanged after a tech-led rally in the final minutes of trading salvaged the session.
The S&P 500 eked out a gain to avoid its worst weekly drop since December, led by a rebound in tech shares spurred by better-than-expected earnings. Equities were under pressure all day after Australia’s central bank joined European and British officials in tamping down economic forecasts, while at the same time the prospects for an extension of the U.S.’s trade detente with China continued to fade.
In corporate news, Motorola (NYSE:MSI) Solutions surged after a strong report. Hasbro (NASDAQ:HAS) tumbled after its earnings disappointed, while rival Mattel (NASDAQ:MAT) gained on a positive results. Amazon (NASDAQ:AMZN) slid as the feud between its CEO and President Donald Trump took an unexpected turn.
NDX suffers the same fate.
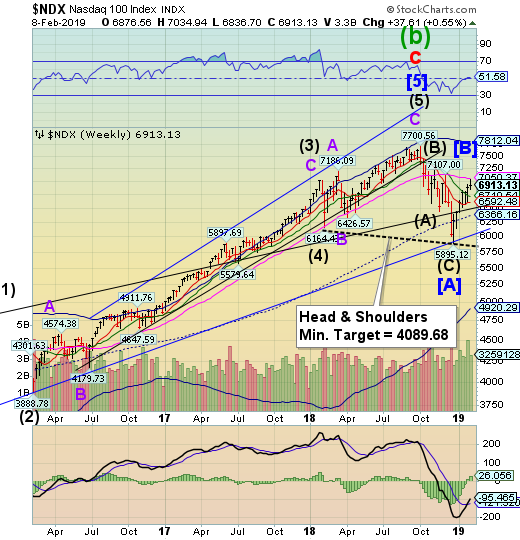
NDX was also prevented from moving beyond Long-term resistance at 7050.37. The Cycles Model suggests that NDX may have completed its rally. There is a potential Head & Shoulders formation that, if triggered, may erase up to 3 years of gains. Stay tuned!
(InvestorPlace) The FAANG stocks — Facebook (NASDAQ:FB) (NASDAQ:FB), Apple (NASDAQ:AAPL) (NASDAQ:AAPL), Amazon (NASDAQ:AMZN) Netflix (NASDAQ:NFLX) (NASDAQ:NFLX), and Google (NASDAQ:GOOGL) (NASDAQ:GOOG, NASDAQ:GOOGL) — have definitely lost the tremendous momentum they had for much of this decade. These big tech stocks are showing increasing weakness.
After the five companies reported their fourth-quarter results, it’s clear that they are all, much as I predicted a year ago, facing tough headwinds. Steepening competition is weighing on the group. All of the FAANG names except for Apple stock are being hurt by their increased spending, while investors are justifiably worried about Apple’s lack of innovation.
Finally, concerns about government intervention are helping to keep a lid on FB and AMZN.
High Yield Bond Index reverses.
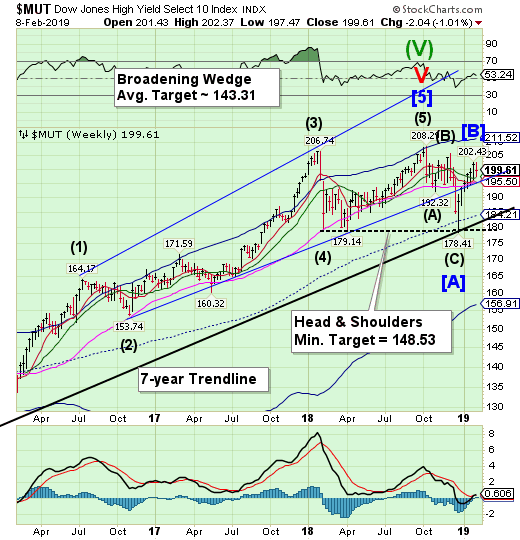
The High Yield Bond Index appears to have made its high last Friday (February 1) before reversing towards Intermediate-term support at 196.98. The Cycles Model suggests up to 6 weeks of decline ahead. The Broadening Wedge trendline at 195.50, if broken, may clear the way to a potential Head & Shoulders formation that may wipe out up to two years of gains in that period of time.
(Bloomberg) Bond traders are dusting off their tried and true post-crisis playbook after the Federal Reserve’s pivot last month. What they don’t realize is that the game has most likely changed.In an unabashed reach for yield, investors suddenly can’t get enough of the riskiest debt, with the Bloomberg Barclays (LON:BARC) U.S. Corporate High Yield Bond Index posting a staggering 5.25 percent total return in the first five weeks of 2019, led by those securities rated in the CCC tier. In the largest CCC borrowing since September, Clear Channel Outdoor Holdings Inc. received orders this week of more than $5 billion for a $2.2 billion deal, allowing it to price its debt to yield 9.25 percent, compared with whisper talk of about 10 percent.
Treasury close above mid-Cycle resistance.
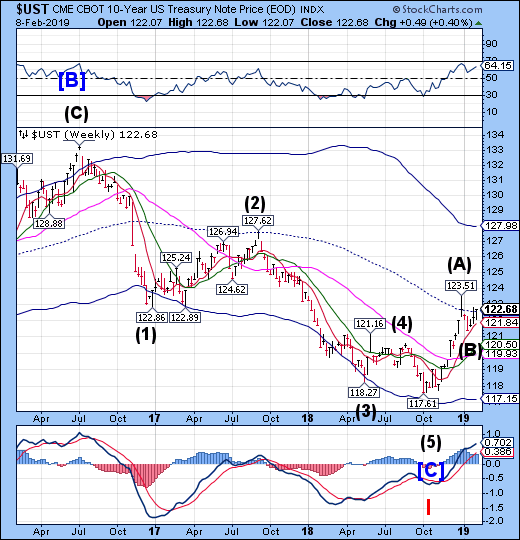
The 10-year Treasury Note Index challenged mid-Cycle resistance at 122.56, closing above it. The breakout above mid-Cycle resistance now gives UST “permission” to rally to the Cycle Top in the next 5-6 weeks.
(ZeroHedge) At the end of January, when combing through the TBAC's latest quarterly refunding presentation, we highlighted what this critical advisory group highlighted as the key risks for the US Treasury market: namely i) the possibility of a significant financing gap over the next 10 years amounting to over $12 trillion and ii) the potential need for more domestic investor participation as foreign investor demand has been steadily declining in recent years.
Specifically, the TBAC cautioned that the Treasury’s financing needs are expected to increase significantly even without factoring in recession possibilities over the next decade. The TBAC warned that deficits to the tune of $1-$1.5trn a year, and cumulatively over $12trn, over the next decade, are coming and will have to be funded in the bond market. This, of course, excludes the potential budget-busting impact of AOC's multi-trillion "Green New Deal."
The euro challenges resistance again.
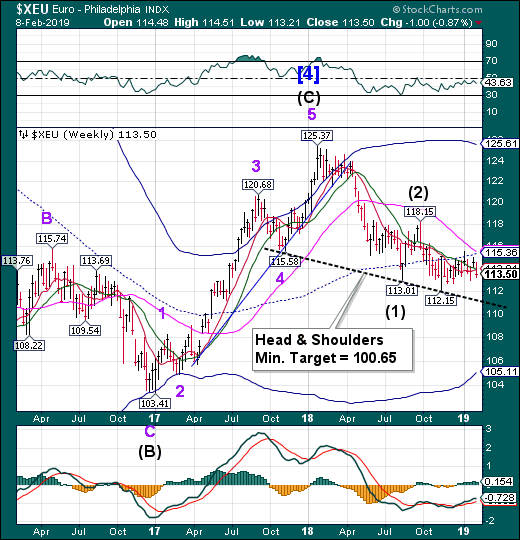
The euro declined beneath Intermediate-term support/resistance, re-establishing its sell signal. There may be a short Cyclical extension that may bounce at the Head & Shoulders neckline near 111.00.However, a decline beneath the neckline may trigger the formation.
(Reuters) - The dollar edged higher against a basket of currencies on Friday, ending its strongest week in six months, as traders piled into the greenback in a safe-haven move on worries about a weakening global economy.
The euro hovered at a two-week low with support at $1.13. The single currency still posted its steepest weekly drop against the dollar in over four months in the wake of data that showed an economic slowdown in Europe was spreading.
“The rally that propelled the dollar broadly higher last year has enjoyed renewed life with U.S. growth remaining solid while peers abroad lose momentum,” said Joe Manimbo, senior market analyst at Western Union Business Solutions in Washington.
EuroStoxx reverses at the 7-year trendline.
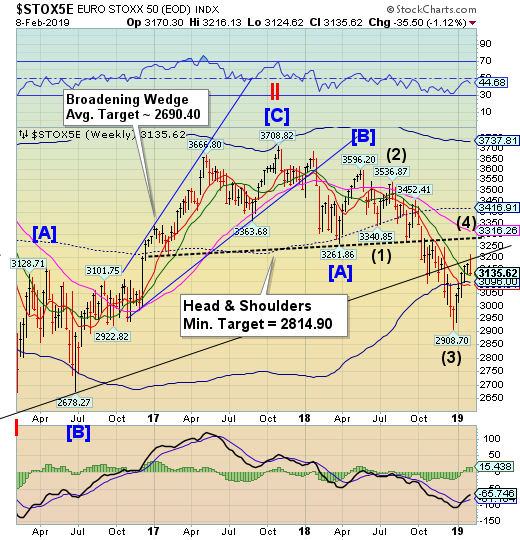
EuroStoxx challenged the 7-year trendline near 3200.00, then reversed down. Thedecline may have started and a loss of Intermediate-term support at 3125.63 creates a sell signal for the Index. The Cycles Model forecasts four or more weeks of decline which may take it to the 22016 lows.
(CNBC) European stocks closed lower Friday amid fears over U.S.-China trade relations and slowing economic growth.
The pan-European Stoxx 600 closed provisionally off by 0.54 percent with most sectors and major bourses in the red. Autos were the worst-performing sector — down 2.19 percent — on growing fears that U.S.-Sino trade relations will deteriorate.
President Donald Trump said Thursday that he would not meet with Chinese leader Xi Jinping before the self-imposed March 2 deadline to reach a Chinese-U.S. trade deal. Failing to reach a compromise by the March 2.deadline would mean additional tariffs on Chinese goods straight away.
The yen consolidates above support.
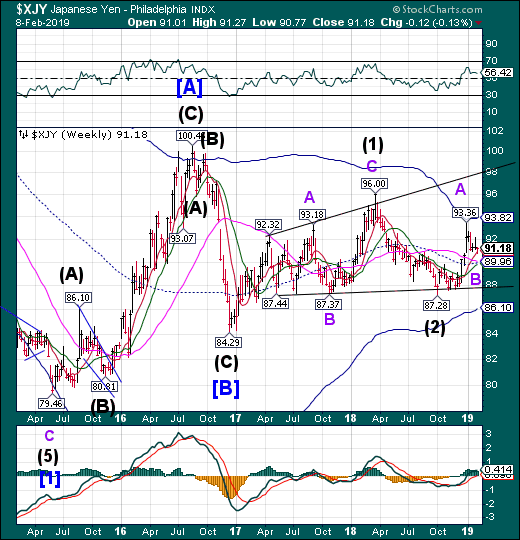
The yen consolidated above Short-term support at 90.92 after challenging it earlier this week. The Cycles Model suggests a continued probe to the upper trendline over the next 1-2 weeks.
(YahooFinance) As investors adjust to the prospect of a slowing global economy, JPMorgan (NYSE:JPM) Asset Management is turning to the yen for protection from an uncertain outlook.
“The yen has the attraction that it’s still very cheap versus its history,” Olivia Mayell, managing director, multi-asset solutions, at the $1.7 trillion investment firm, said in Sydney. “Our fundamental view is that it does get a little bit stronger from where it’s been regardless of market stress. It’s one of the cheaper hedges you can put in the portfolio today.”
Other hedging tools that more closely track volatility -- like The Cboe Volatility Index, known as the VIX, or buying put options on the S&P 500 Index -- have become more expensive, said London-based Mayell, who is part of a team overseeing the JPMorgan Global Macro Opportunities Fund.
Nikkei stumbles beneath resistance.
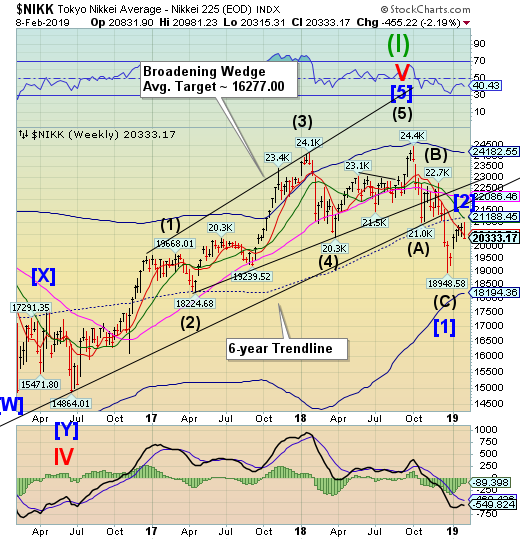
The Nikkei peaked on Tuesday but stumbled badly the rest of the week. The reversal came on schedule and anticipates the next Master Cycle low at the end of February, according to the Cycles Model.
(NikkeiAsianReview) Japanese multinationals heavily invested in China are suffering a sharper earnings contraction than listed companies overall, their latest earnings reports show.
Net profit among components of the Nikkei China Related Stock 50 index -- which tracks the most active names expanding in China, such as Panasonic, Komatsu and Nissan Motor -- fell 8% on the year for the three quarters ended in December. This compares a with 2.9% drop for Japanese listed companies overall, based on results issued as of Thursday.
Japanese companies have weathered slowdowns in China's economy before. But as China shifts from the "world's factory" to one of the most important consumer markets, the impact of any loss of momentum has been magnified.
U.S. dollar Stalls At Mid-Cycle Support
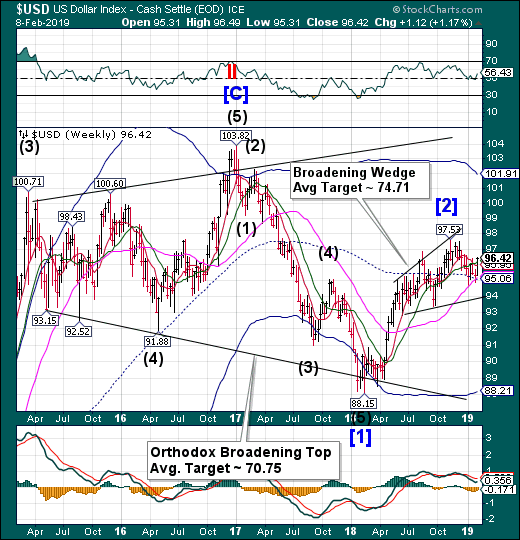
USD challenged Intermediate-term resistance at 96.18, closing above it for the week. However, the USD may have set up a bull trap (a Cycle inversion), since the Cycles Model anticipates a month or more of decline, starting imminently.
(BusinessTimes) The US dollar edged higher against a basket of currencies on Friday, ending its strongest week in six months, as traders piled into the greenback in a safe-haven move on worries about a weakening global economy.
The euro hovered at a two-week low with support at US$1.13.
The single currency still posted its steepest weekly drop against the US dollar in over four months in the wake of data that showed an economic slowdown in Europe was spreading.
"The rally that propelled the dollar broadly higher last year has enjoyed renewed life with US growth remaining solid while peers abroad lose momentum," said Joe Manimbo, senior market analyst at Western Union Business Solutions in Washington.
Gold pulls back from the high.
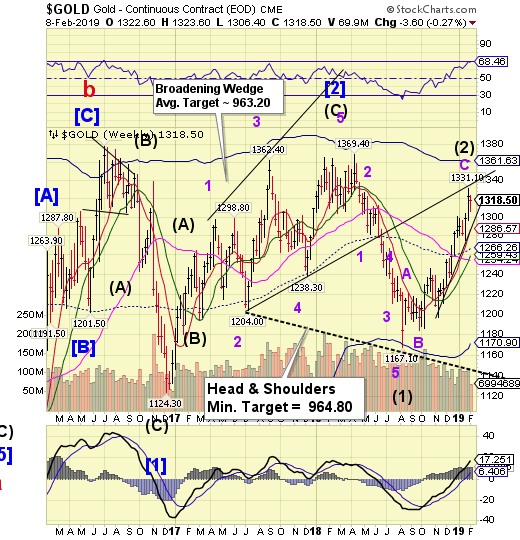
Gold pulled back from the high at the trendline, closing at a small loss for the week. According to the Cycles Model, Gold may continue declining through mid-March. Both chart formations agree the low may exceed the prior one last seen in 2015.
(CNBC) Gold held steady on Friday en route to its first weekly loss in three, pressured by gains in the dollar, but kept above the $1,300 level by concerns over economic growth in Europe and elsewhere.
Spot gold was steady at $1,314.17 per ounce, as of 2 p.m. ET, after hitting its lowest since Jan. 29 at $1,302.11 on Thursday. U.S. gold futures settled up $4.30 at $1,318.50.
"The major headwind is the pretty resilient dollar at the moment," said Philip Newman, director at Metals Focus. "There are quite a few concerns - economically, financially and politically - and yesterday, there was a downgrade in European growth (forecast)."
The crude rally may wind down.
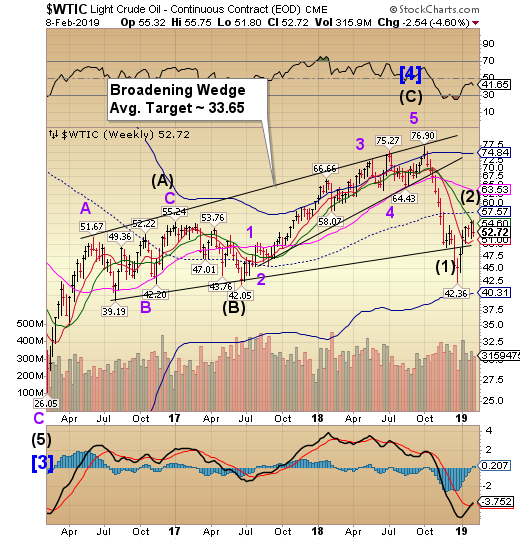
Crude oil probed to Intermediate-term resistance on Monday, then proceeded to decline the rest of the week. The Cycles Model now suggests the decline may continue through mid-March.A cross beneath Short-term support at 51.00 may put Crude on a sell signal.
(OilPrice) Hedge funds and other money managers have started to shake off the gloomy expectations of a global recession and waning oil demand growth that had seized market participants for most of the fourth quarter last year.
Over the past weeks, fund managers have run to cover a lot of short positions as OPEC’s new production cuts and U.S. sanctions on Venezuela’s oil have given a bullish push to the market.
Money managers have been lifting their combined net long position—the difference between bullish and bearish bets—in Brent Crude for most of 2019 so far.
Yet, the primary driver for the increase in the net long position was the closing of the many shorts from late 2018, rather than a renewed bullishness that oil prices will be rallying.
Shanghai Index went on vacation this week.
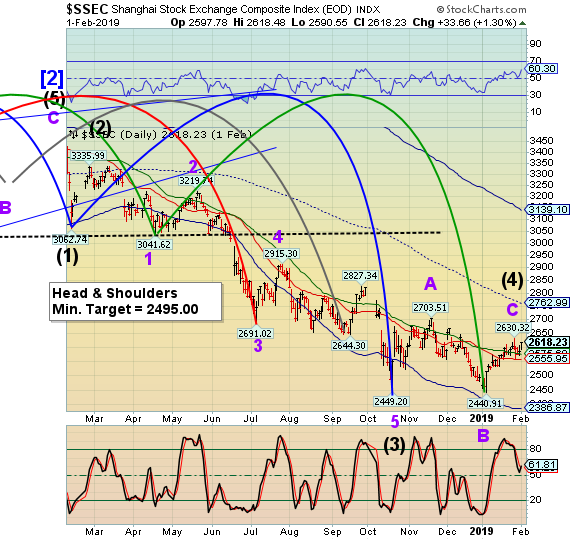
The Shanghai Index closed until February 11. The Cycles Model suggests it may resume its decline next week with a potential bottom near 2000.00-2200.00.
(Reuters) - Hong Kong stocks ended weaker on Friday as the absence of any positive signs for a resolution in the U.S.-China trade row dented sentiment, but the market pared losses as investors eyed support from A-shares, which will resume trading next week. **
