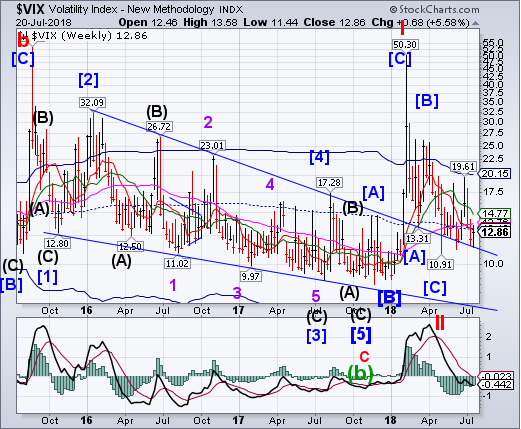
VIX pulled back to test its 2-year trendline again, closing beneath its Short-term support/resistance at 13.29. The buy signal has been suspended until it rises above that level. The Cycles Model shows probable strength for the VIX through mid-August.
(Bloomberg) After a storm comes the calm...eventually.
Front-month VIX futures closed at 12.12 on Tuesday, their lowest finish since before the record explosion in volatility in February, which roiled markets and wiped out several exchange-traded products that let investors bet on market tranquility.
VIX futures contracts are tied to the Cboe Volatility Index, a gauge of the one-month implied swings for the S&P 500 Index that’s often called the VIX or Wall Street’s “fear gauge.”
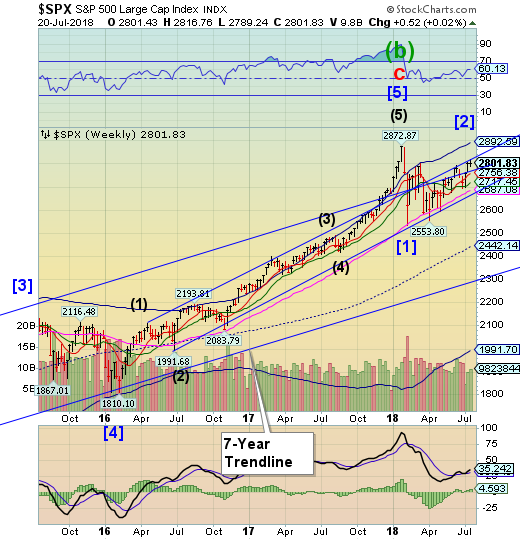
SPX consolidates beneath the upper 2-year trendline.

SPX challenged the upper trendline of the 2-year trading channel for a second week at 2816.00. This final bit of strength also coincides with an important Cyclical turn date. This may be one of the longest stock market corrections in history, having ventured 159 days from bottom (February 9) to top (July 18). Equities are entering their negative season, so care should be taken to protect what small profits there are in 2018.
(Reuters) - U.S. stock indexes edged higher on Friday as technology stocks rose on the back of solid results from Microsoft (NASDAQ:MSFT), easing fears of a rising trade spat after President Donald Trump toughened his stance against China.
Microsoft rose as much as 3.6 percent to a record high of $108.20 and was the biggest boost to the S&P 500 and the Dow Industrials.
President Trump said he was ready to impose tariffs on all $500 billion of imported goods from China, unnerving financial markets in premarket trading.
His comments on tariffs followed the United States and China imposing levies on $34 billion worth of each other’s goods earlier this month.
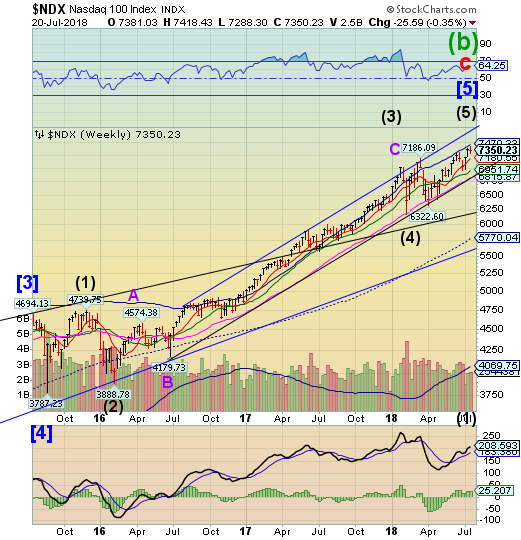
NDX consolidates near its Cycle Top.

NDX consolidated at its Cycle Top resistance at 7470.22, closing beneath it. The Cycles Model suggests that the next several weeks may bring pain to equities. The period of weak seasonality may be about to begin.
(NorthmanTrader) The NDX keeps moving from new highs to new highs driven by a narrow group of stocks. Nothing new about that as this trend has been ongoing for some time and headlines of new record prices for such stocks such as Facebook Inc (NASDAQ:FB), Amazon.com Inc (NASDAQ:AMZN), Alphabet Inc Class A (NASDAQ:GOOGL), MSFT are now a daily occurrence. The untouchables. Jeff Bezos is worth $140B, no that was so last week, now he’s worth $150B.
How do you quantify risk in a market that prices in no risk?
While most people are focused on stocks prices one underlying issue that appears to be largely ignored by participants is the unprecedented market capitalization expansion we are witnessing in these few select stocks.
The numbers are simply staggering. Magic money out of thin air.
FB, GOOGL, AMZN, MSFT and Apple Inc (NASDAQ:AAPL). These 5 stocks now worth nearly $4.1 trillion. That makes these 5 companies the 4th largest economy of the world if you use GDP as a reference. Not bad for less than a million people employed at these 5 companies.
To read the entire report Please click on the pdf File Below:
