REVIEW
The market started the holiday shortened week at SPX 2423. After a gap up opening on Monday the market rallied to SPX 2439. The market pulled back to SPX 2422 by Wednesday morning, then rallied to 2435 in the afternoon. A gap down opening on Thursday took the SPX to 2408 near the close. Then a gap up opening on Friday rallied the market to SPX 2427. For the week the SPX/DOW gained 0.2%, and the NDX/NAZ gained 0.2%.
Economic reports for the week were slightly negatively biased. On the downtick: auto sales, factory orders, the ADP, the WLEI, plus jobless claims and the unemployment rate rose. On the uptick: ISM manufacturing/services, monthly payrolls, plus the trade deficit improved. Next week’s reports will be highlighted by FED chair Yellen’s testimony to Congress, the Beige book, and industrial production. Best to your week!
LONG TERM: uptrend
We just published a report, just before this one, that explains the difference between subjective/interpretive Elliott Wave and quantified/objective Elliott Wave. The former attempts to interpret the waves by what one observes on the charts. The latter, which we use, interprets the waves mathematically. When waves are not quantified, any number of interpretations are possible. When waves are quantified, a limited number of wave labeling interpretations, at any one time, are possible. Infinite or finite you be the judge.

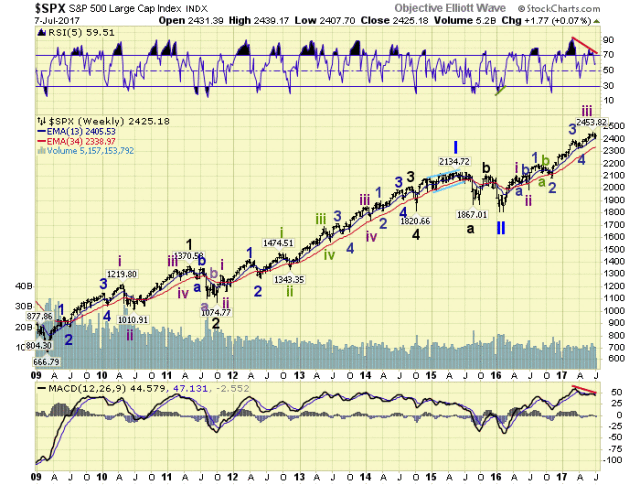
The long-term bull market continues. From the Primary wave II bear market low in February, 2016 at SPX 1810 we have been tracking the waves of the current bull market. Intermediate waves i and ii ended in the spring of 2016. Minor waves 1 and 2, of Int. iii, ended in the fall of 2016. Minor waves 3 and 4 ended in the spring of 2017. Recently Minor wave 5, completing Int. iii, just ended in June 2017. This suggests an Intermediate wave iv correction is now underway. Support for this correction appears to be in the OEW 2321/2286/2270 pivot range, with an expected cycle low due in September.
MEDIUM TERM: downtrend
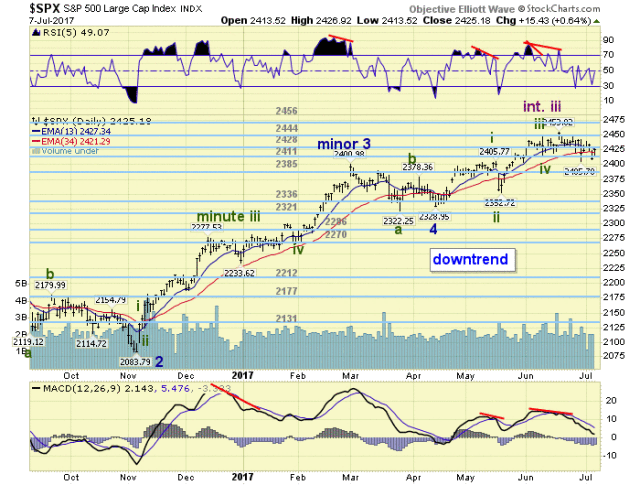
The recent Minor wave 5 uptrend advanced from SPX 2329 in mid-April to SPX 2454 in mid-June. This uptrend took two months, but was the smallest advance of the four impulse uptrends to date in this bull market. Typical of a fifth wave. The uptrend unfolded in five Minute waves: 2406-2353-2446-2419-2454. At the high the SPX was displaying negative weekly RSI/MACD divergences, and negative daily RSI/MACD divergences.

With the SPX downtrend now confirmed we should be looking for a few technical events to occur before this downtrend ends. Each of the corrections, during this bull market, have been three wave a-b-c declines. Some complex, one simple. In each case the daily RSI was quite oversold during both waves A and C. We have not seen either yet. Also the A wave of each downtrend has dropped between 75 and 85 points. This downtrend has only dropped 48 points thus far (2454-2406). This suggests the SPX could drop into the 2370’s before even the A wave of this correction ends. Medium term support is at the 2411 and 2385 pivots, with resistance at the 2428 and 2444 pivots.
SHORT TERM
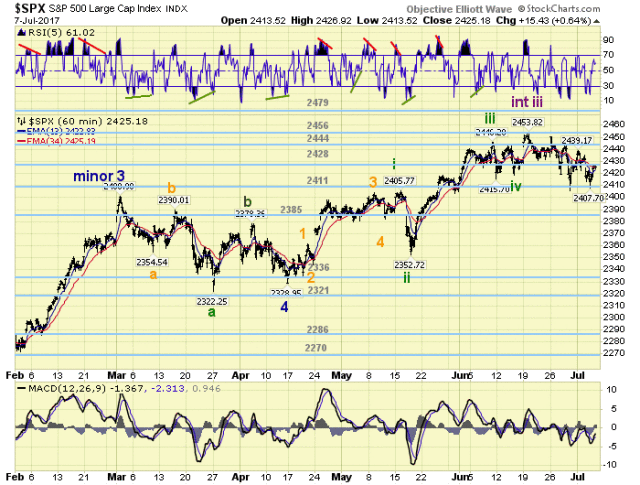
While the uptrend was a clean five waves on the two short-term timeframes we track. The correction thus far has been a series of overlapping waves. Typical of a correction. Thus far [2454]: 2431-2450-2419-2443-2406, then 2439-2408-2427. Quite choppy and difficult to count.

While the SPX/NDX/NAZ have already confirmed downtrends, the DOW has not. We are expecting the A wave of the Int. iv correction to end when the DOW does confirm a downtrend. Short term support is at the 2411 and 2385 pivots, with resistance at the 2428 and 2444 pivots. Short term momentum ended the week nearly overbought.