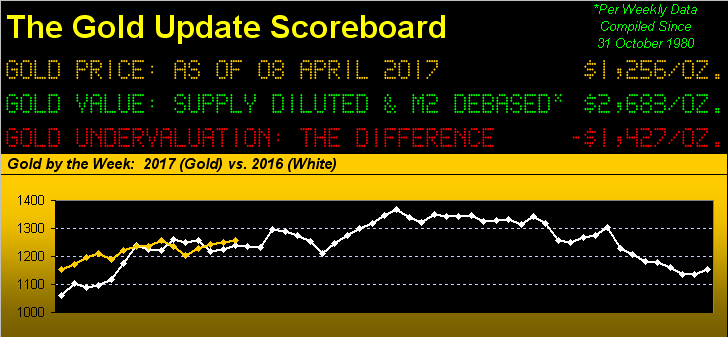
Gold failed to follow-through from two fundamental forces which for Friday's session flew past in a 12-hour blast. In turn, cue gold's technical view and the year-to-date up run may be through, at least for a week or few. To be sure, a glance at the above panel shows gold gliding along just off the tarmac of where 'twas at this time a year ago. But in settling out the week yesterday at 1256 came the following screen from our end-of-day mix:
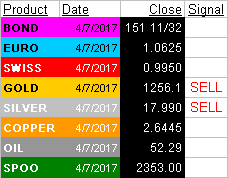
The two fundamental catalysts upon which gold could not follow-through in yesterday's (Friday's) session were:
■ the U.S.' response to Syria's humanitarian atrocities, gold leaping from 1252 to 1271 in 60 minutes, before backing off to 1263; and then 12 hours later,
■ the U.S.' Department of Labor report for interest rate-relieving marginal growth in payrolls and hourly earnings, gold in turn re-leaping to 1273, only to then give it all back in settling the week at 1256.
Reminiscent of the '73 Elton John piece "I've Seen That Movie Too", we oft dubiously view gold's capitalizing on geo-political events, typically with the Syrian affair of the impulsive safe haven rush in spiking price up, only to be followed by a sauntering back down from whence it came. But then, the failure for gold to hold its gains post-payrolls -- the weakening data from which almost shall surely keep the Federal Open Market Committee at bay come 03 May -- and 'twas "TILT! ... Game Over", perhaps for a bit anyway. Here's why we so say:
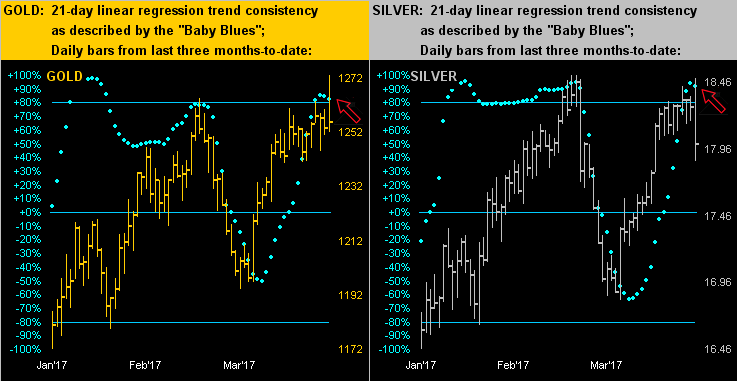
Open the technical tool-kit and this is what we find. See the word "SELL" next to both gold and silver in the prior graphic? This is what generates those signals: yes, as below denoted by the two red arrows, our old prescient friends the "Baby Blues" have just kinked down within their scales' +80% levels. That means the consistencies of the recent uptrends for both gold on the left and silver on the right have started to erode. And as you look across the two panels, indeed if you regularly following the "blues" day-by-day at the website, you know they're fairly reliable in heralding changes in trend:
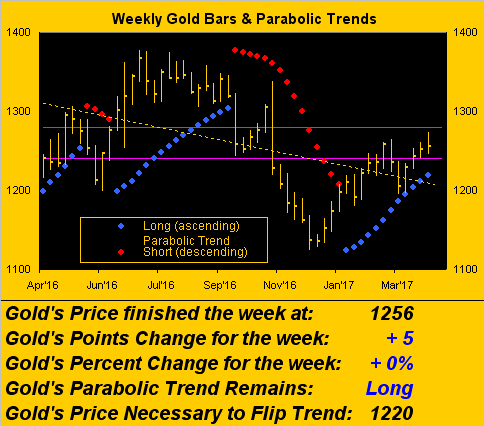
Thus to gold's weekly bars from a year ago-to-date we go. And at first blush, gold therein continues to look pretty good, staying clear above the ever-rising parabolic Long trend dots, the flip-to-Short level for which is now up to 1220. 'Course, the dirty little secrets are the descending dashed overall trendline across the breadth of the chart, and of more immediacy, gold's inability to escape above the purple-bounded 1240-1280 resistance zone. Friday's fundamentals were the ticket to so do; instead we saw but fizzles ensue. Here's the view:
Again, our sense for lower gold levels is merely a near-term notion. More broadly, the good news technically is the recovering appearance in price as it on balance continues to climb out from the depths of December 2015, albeit gold at the moment (1256) is but one point above the 300-day moving average (1255), which itself is in ascent:
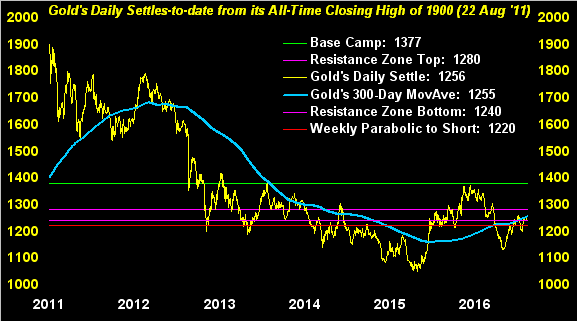
'Course, it goes without saying, (and indeed is always worth repeating), that more broadly the good news fundamentally is gold's still being valued in the market (1256) at less that half what 'tis worth by our scoreboard (2683), per StateSide currency debasement alone, even accounting for the yellow metal's supply having doubled over the last four decades.
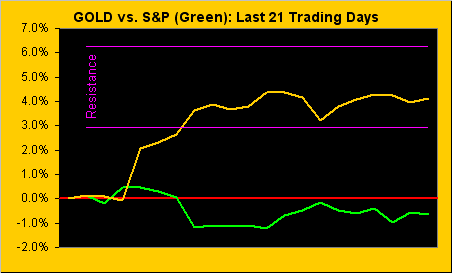
Further, as we saw in our month/quarter-end standings a week ago, silver remains the clear year-to-date winner (now +13%), followed by gold (+9%), with the stock market as usual getting all the ga-ga attention, (the S&P 500 being +5%). Still, stocks have been stuck month-over-month, whilst gold had been working higher before again becoming entrapped inside the resistance zone, percentage-positioned along the trading track as shown:
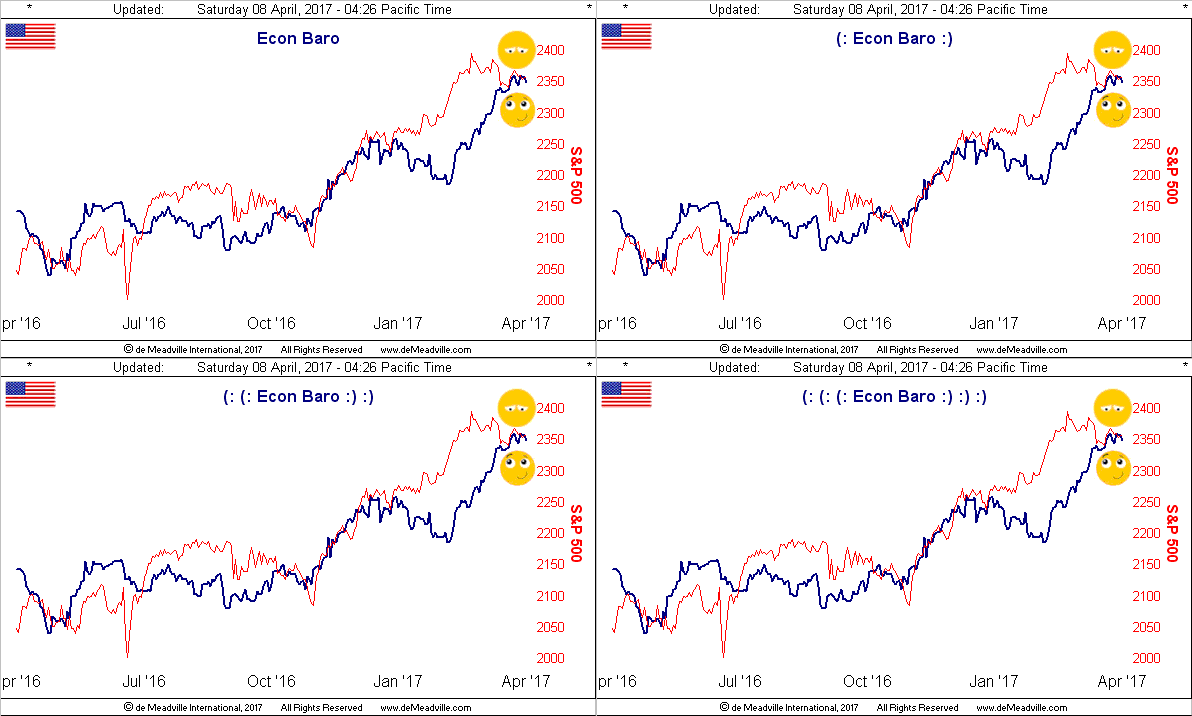
Meanwhile, as earlier noted with respect to the slowing payrolls data, other incoming metrics this past week added to some stalling in what has year-to-date been a torrid pace of economic improvement, cooling culprits including a slowing in: Factory Orders, the Institute for Supply Management's manufacturing and services measures, Vehicle Sales, and in the movement of Wholesale Inventories. Hence the most recent wrinkling in the Econ Baro:
Indeed, just when we thought we'd figured out the Fed, the picture there is becoming more murky instead. 'Tis not just Richmond FedPres Jeffrey "Maverick" Lacker's resigning that's stirring the pot; the 14/15 March meeting minutes of the FOMC show them giving material consideration to finally shrinking the Fed's balance sheet by not rolling over maturing Bond purchases. So who's gonna by 'em instead, eh? Bye-Bye Bond? Got Gold?
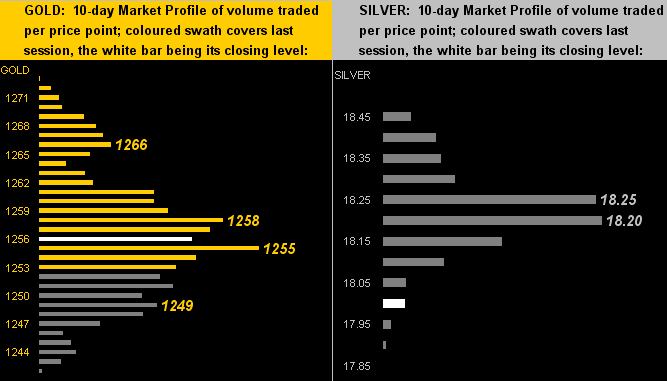
In the meantime, the fundamental wild card which could re-buoy gold and silver through here may be the furtherance of instability in the eastern Mediterranean, (not to mention the excitability of one Kim Jong-un, should he not opt for hidability). But if our technical take plays out, we'd see both gold (below left) and silver (below right) fall under the current layout of their respective 10-day Market Profiles. Presently we have gold clinging to trading support at 1255, whilst Sister Silver (in settling the week at 17.99) has already sailed somewhat south of her 18.20 line-in-the-sand:
Finally for this week, we couldn't help but notice Chow Tai Fook Jewellery's chairman Henry Cheng Kar-Shun phoning in the winning bid over at Sotheby's for the 59.6 carat "Pink Star" diamond toward forking over some HK$553 million for the wee rock. At gold's current price, that works out to about 1.6 metric tonnes -- not quite 1% of the world's total above-ground gold supply -- or by comparable weight, that of an adult male giraffe. Impressive, eh? But wait, there's more: reverse engineer it all and given that 59.6 carats of diamond equates to 0.42 ounces, Ole Henry paid the equivalent of US$169 million/oz. for his pink treasure. Anyway, in doing our public duty, we've alerted Inspecteur Clouseau ... just in case.