Market Brief
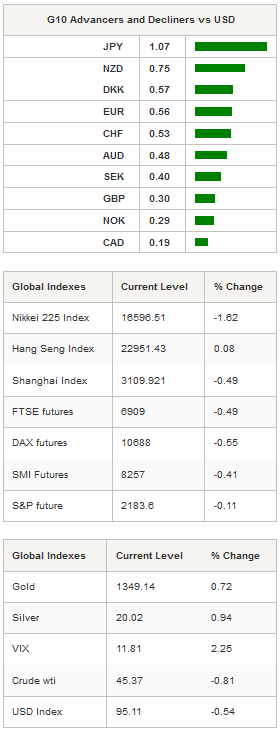
USD took a dive on Tuesday as market participants await the publication of July FOMC meeting minutes. The market is growing anxious that the Fed has become increasingly dovish amid a weak global outlook and a strong easing bias from most central banks across the globe. The greenback lost ground against all G10 currencies but fell the most against the Japanese yen, the Kiwi and the Aussie.

USD/JPY broke the bottom of its monthly range at 100.68 (low from August 2) and is now testing the following support area at between 99.02-100.60 (low from June 24, psychological level and Fibonacci 50% on 2011-2015 rally). Overall, the technical structure suggests a long-term bearish outlook. The next key support can be found at 94.64 (Fibonacci 61.8%).
Most commodity currencies extended gains overnight in spite of a stabilisation in crude oil prices. However, the strong rally in precious metals provides little help for the Aussie. Gold rose 0.70% in Tokyo and tested the $1,350 level, while the Australian dollar surged 0.45% to 0.77 against the greenback. The Australian dollar continued to trade on firmer footing in spite of a rate cut from the RBA in early August as investors are desperately chasing higher yields. The publication did not provide further clarity about whether the central bank would deliver another cut before the end of the year. AUD/USD is about to test the bottom line of its multi-year downtrend channel currently at around 0.7750. AUD/USD does have downside potential but it seems that only a pick-up in Fed rate hike expectations could help the RBA to depreciate the Aussie.
At the time of writing, EUR/USD was attempting to break the 1.1231-1.1234 resistance level (Fibonacci 61.8% on June’s debasement and high from August 2). Since Brexit, the single currency has been trading mostly sideways as investors assess the short and long-term consequences of an exit of the UK from the European Union. The process is not done yet, meaning that EUR/USD’s rise is mostly due to dollar weakness rather than a strong euro.
In the equity market, Asian regional markets were trading lower across the board as traders took profit after the recent rally. The Japanese Nikkei was down 1.62% and the Topix index fell 1.38%. In mainland China, the CSI 300 was down 0.36%. Offshore, Hong Kong’s Hang Seng edged up 0.08%, while in Taiwan the Taiex fell 0.42%. Finally, in Europe equity futures are following the Asian lead, trading broadly in negative territory.
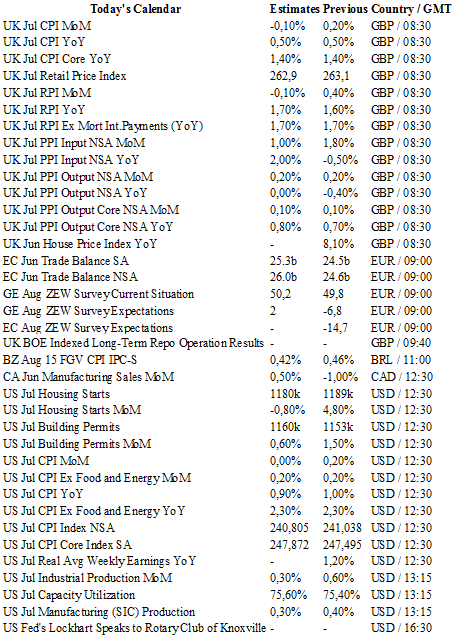
Today traders will be watching inflation report, retail price index, RPI and PPI from UK; ZEW survey from Germany; manufacturing sales from Canada; housing starts, building permits, CPI, industrial production and capacity utilization from the US.

Currency Tech
EUR/USD
R 2: 1.1428
R 1: 1.1234
CURRENT: 1.1240
S 1: 1.0913
S 2: 1.0822
GBP/USD
R 2: 1.3534
R 1: 1.3372
CURRENT: 1.2897
S 1: 1.2851
S 2: 1.2798
USD/JPY
R 2: 107.90
R 1: 102.83
CURRENT: 100.27
S 1: 100.00
S 2: 99.02
USD/CHF
R 2: 1.0328
R 1: 0.9956
CURRENT: 0.9678
S 1: 0.9634
S 2: 0.9522
