The U.S. dollar managed to hold its ground on Monday as investors brace for Fed Chair, Powell's semi-annual testimony to Congress later today. Although Powell hasn't yet officially chaired any FOMC meetings, his testimony could be seen as a major indicator of how monetary policy will be steered under his governance.
On the economic front, Mario Draghi gave his testimony to the European parliament on Monday. No major references were made to monetary policy. He however said that the central bank needs to remain patient with inflation. In the U.S. new home sales data showed a decline as home sales rose only 593k missing estimates of 655k.
Looking ahead, the economic calendar today is busy. The U.S. durable goods orders data will be coming out and forecasts point to a decline on the headline print. Germany and Spain will be releasing the flash inflation readings while Canada will be releasing its annual budget plans.
EUR/USD intra-day analysis

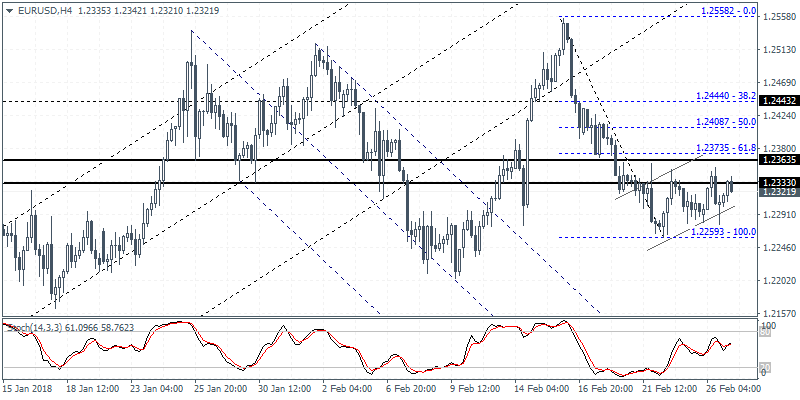
EUR/USD (1.2321):The EUR/USD attempted to rally to intraday highs but price action was seen closing lower on the day off the highs. On the 4-hour chart, we see the bearish flag pattern being formed, right below the main resistance level where the EUR/USD has been consolidating. A break down below the base at 1.2260 could signal further declines targeting 1.2074. Alternately, EUR/USD will need to close strongly above the resistance level in order to invalidate the downside bias. However, in this scenario, we still expect to see consolidation taking place unless the EUR/USD manages to post fresh highs./
GBP/USD intra-day analysis

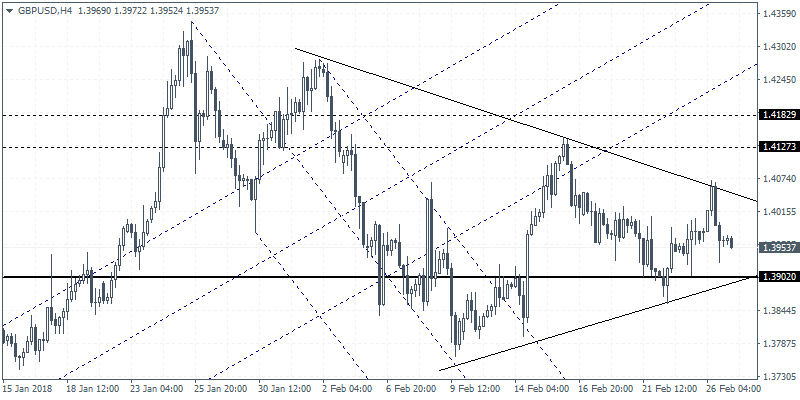
GBP/USD (1.3953):The British pound closed bearish yesterday despite intraday attempts to push higher. However, with price still trading above the 1.3902 level of support, we expect to see some upside bounce in price. A break down below 1.3902 is required to confirm the decline towards 1.3530. On the 4-hour chart, GBP/USD remains trading within the triangle pattern. We expect price to touch down to the initial support at 1.3902. A break down below this level could validate the downside breakout in the triangle pattern as price action could be seen targeting 1.3530 level.
XAU/USD intra-day analysis

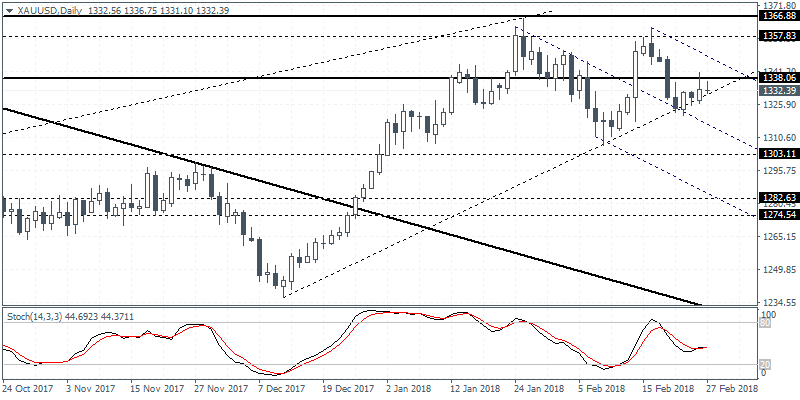
XAU/USD (1332.39):Gold prices rallied briefly towards 1338 level but failed to close higher on the day. As price retreated, the consolidation over the past few days could trigger a downside breakout as long as the established resistance at 1338 is not breached. The initial target to the downside remains at 1303 level. Further declines could be expected as gold prices could likely touchdown to the 1282 - 1274 region of main support that is yet to be tested. In the event that gold prices manage to close above 1338, then the bias shifts to the upside with the next upside target seen at 1357.
