
Investors and traders will focus on the situation in the US labor market, as it could give hints of how the Federal Reserve will approach its monetary policy in the near future. Also, Canada will deliver its unemployment and participation rate. UK’s construction PMI is also on the agenda.
US Labor Market In The Spotlight
Yesterday, the US released some of its labor market related data. Among the data were the US initial and continuing jobless claims figures for the past week, together with the ADP nonfarm employment change reading for the month of May. The latter one managed to come as a positive surprise, beating the forecast of 650k and showing up at 978k. Traders and investors do look at the ADP figure in order to try and gauge the outcome for the main NFP number, however, we have always noted that the two data sets do not always go hand in hand with each other.
In regards to the initial and continuing jobless claims, the initial ones come out at 385k, which is slightly better than the expected 390k. However, the continuing ones showed up at 3771k, which is lower than the forecasted 3615k. This raises a few concerns, as it could mean that the number of people still seeking financial support from the government is still on higher side. In the US southern regions, some farmers are currently suffering from drought, which is killing off harvest. This means that farmers would not require the usual number of workers to work on their land, potentially resulting in workers being left without jobs and wages. This might weigh in on the unemployment rate later on.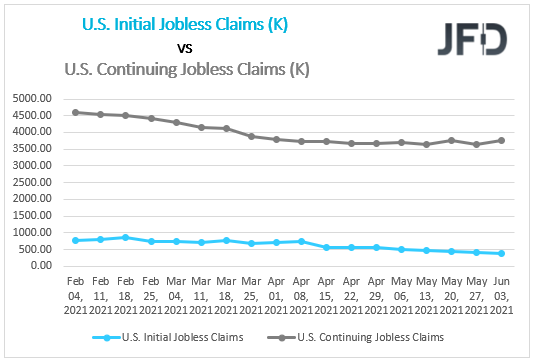
The country is also set to deliver its main jobs figure for May, which will be heavily monitored by investors across the globe. Currently, market participants are expecting for the actual number to come out at around 650k, where the previous was at 266k. Certainly, when the US Federal Reserve states that businesses are currently having difficulties of finding enough workers, we then understand from where these higher forecasts are coming from. If that’s the case, we may see average hourly earnings pushing a bit higher. The current expectation for the YoY average hourly earnings for May is at +1.6%, against the previous +0.3%. In regards to the unemployment rate, the current forecast sits at 5.9%. This would be a 0.2% fall from the previous 6.1%, which could create an even better image for Biden’s office in his first year of presidency.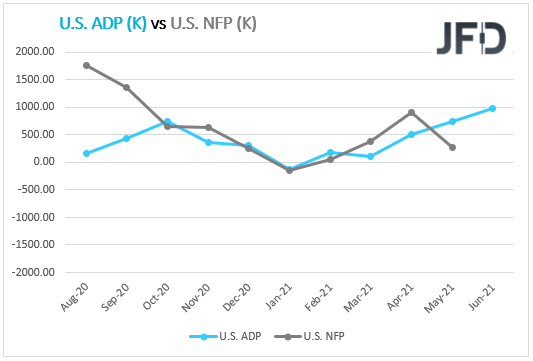
However, let’s not forget that there was a lot of positivity before the previous NFP release as well, where the prognosis was for a huge 978k increase. But the actual reading came out at 266k, which was far from the initial expectation. If today’s NFP comes out below forecast, we may see the Fed sticking to its current policy. But if the actual NFP figure comes out higher than the forecast, this could bring the Fed one step closer to policy normalization. It would then be seen that the US economy is recovering well, meaning that adjustments in the interest rate might be done sooner. And although this may be considered as a positive and we could see the stocks pushing slightly higher, the idea of higher interest rates in the future might have a negative effect on equities, forcing them to reverse slightly lower.
However, the US dollar could be seen as one of the main benefiters from this, as dollar-bulls would welcome higher interest rates. Also, higher rates could help keep US inflation under control. Given the recent US CPI release, market participants are cautious of how it will go on further, as rising oil prices are slowly becoming a concern as well.
USD/CAD Technical Outlook
From around mid-May, USD/CAD continues to trade within a range, which is roughly between the 1.2013 and 1.2137 levels. Currently, the rate is closer to the upper side of the that range, which increases the chances of seeing a breakout through the 1.2137 barrier. That said, until the actual break happens, we will take a neutral stance.
If, eventually the upper side of the range surrenders and breaks, this will confirm a forthcoming higher high, potentially attracting more buyers into the game. The pair might then drift to the 1.2202 obstacle, or to the 1.2251 zone, marked by the low of May 5. USD/CAD could retrace back down from there, however, if it is able to remain above 1.2202 hurdle, or the 200 EMA, new buyers may step in. If that happens, the pair could get pushed north again, where the next possible target might be at 1.2350, marked by the highest point of May.
In order to consider the downside, a break of the lower side of the range, at 1.2013, would be needed. This would confirm a forthcoming lower low, possibly opening the door towards the 1.1920 area, marked by the lowest point of May 2015, which may provide a temporary hold-up. If the slide continues, the next possible target might be the 1.1835 level, marked by the low of Jan. 12, 2015.
EURO STOXX 50 Technical Outlook
Although the Euro STOXX 50 index continues to trade well above the short-term tentative upside support line taken from the low of May 13, for the past two weeks the price has been moving within a rising channel pattern. As long as the index continues to trade within that channel, we will stay strongly bullish.
The price may rise back to the current highest point of June, at 4101, which could provide strong resistance once again. Even if Euro STOXX 50 drifts back down from there, as long as the lower side of the rising channel remains intact, we will stay positive. The buyers might take advantage of the lower price and push it higher again, possibly even overcoming the 4101 barrier and targeting the upper side of the rising channel.
Alternatively, if the lower bound of the aforementioned channel breaks and the price falls below the 4051 hurdle, marked by yesterday’s low, that may temporarily spook new buyers from the field. The sellers could then drag Euro Stoxx 50 to the 4034 obstacle, or to the 4017 zone, marked by the low of May 27. If the selling continues, the next potential support level might be seen near the psychological 4000 mark, which is near the low of May 21. Slightly below runs the previously discussed upside line, which could provide additional support.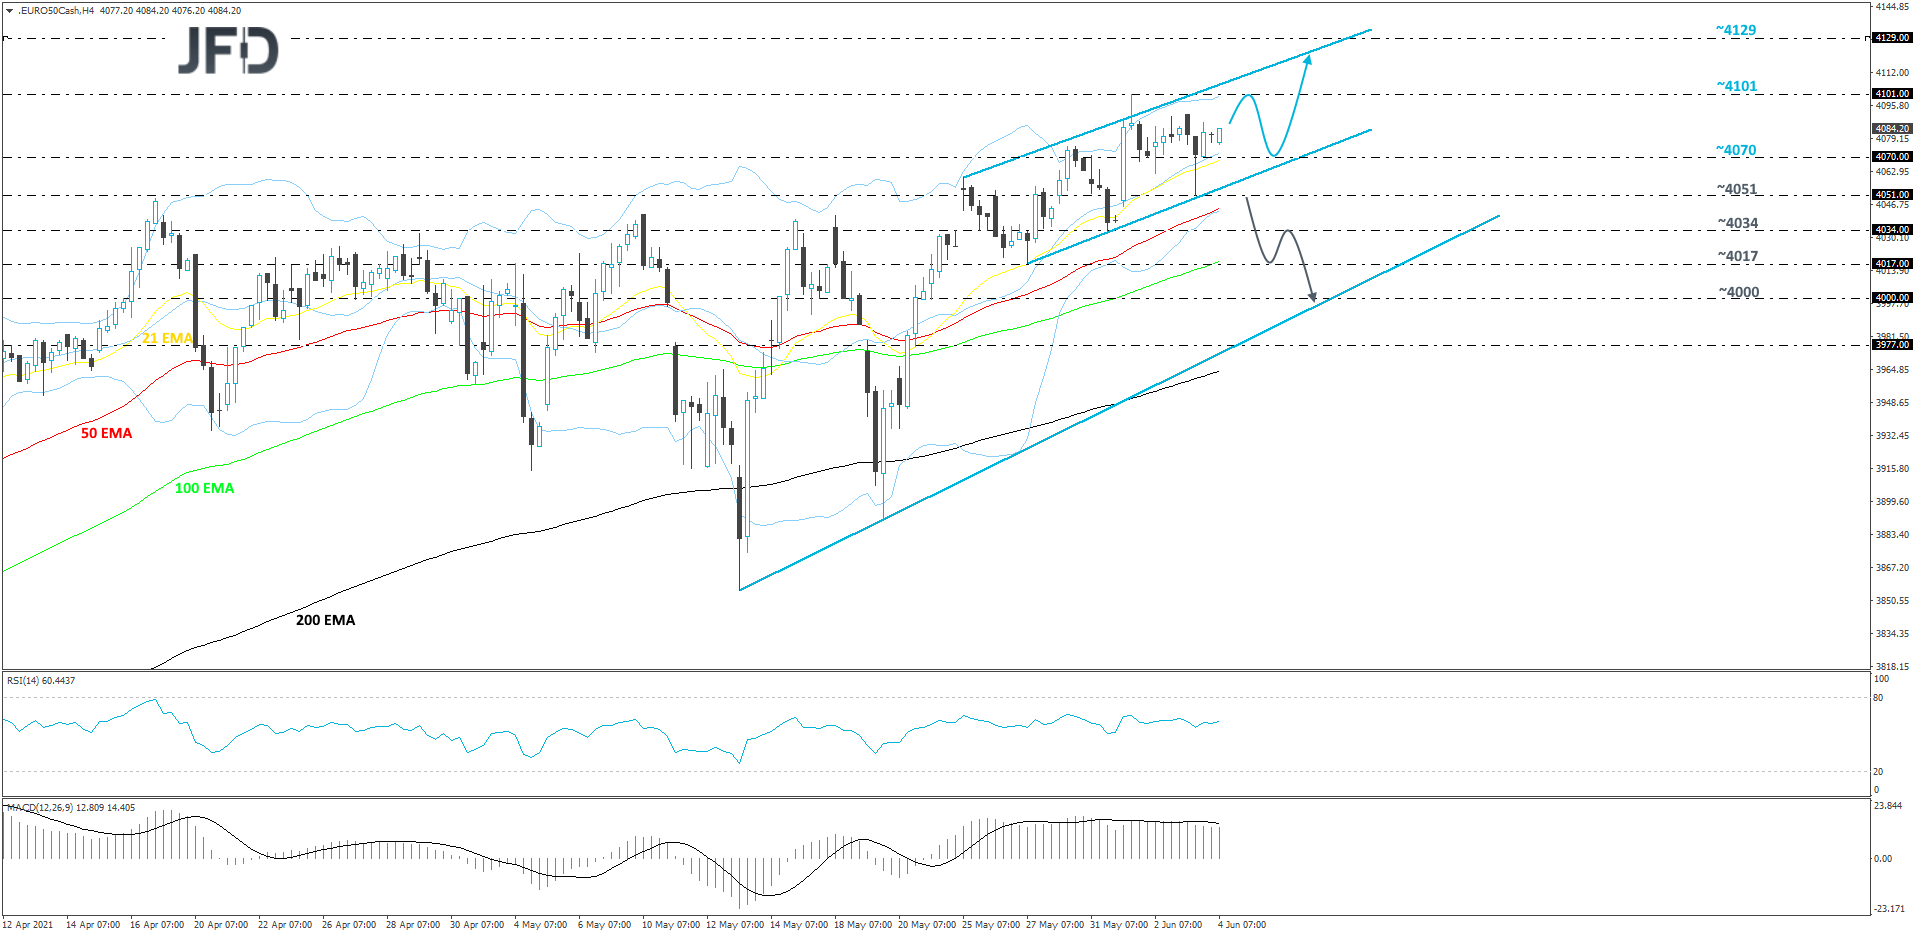
As For The Rest Of Today's Events
Canada is also set to release its jobs numbers for May. The unemployment rate is expected to increase slightly, from 8.1% to 8.2%. The employment change is believed to have improved, going from -207.1k to -20.0k. From Europe we will receive the eurozone’s retail sales numbers for April, both MoM and YoY ones. The MoM is expected to decline from +2.7% to -1.2%, whereas the YoY reading is forecasted to go from 12.0% to 25.5%.
During the European morning we will receive the UK’s construction PMI figure for the month of May, which is expected to rise from 61.6 to 62.3.