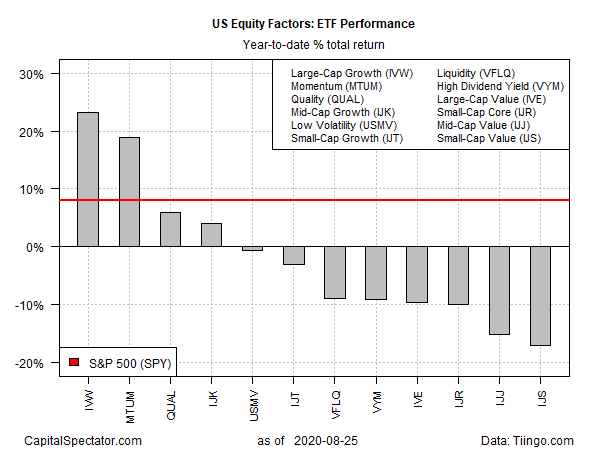
There’s nothing subtle about the span of year-to-date returns for a broad set of US equity risk factors. At the extreme, the spread between the strongest and weakest performances is a stunning 40 percentage points, based on a set of exchange traded funds through yesterday’s close (Aug. 25).
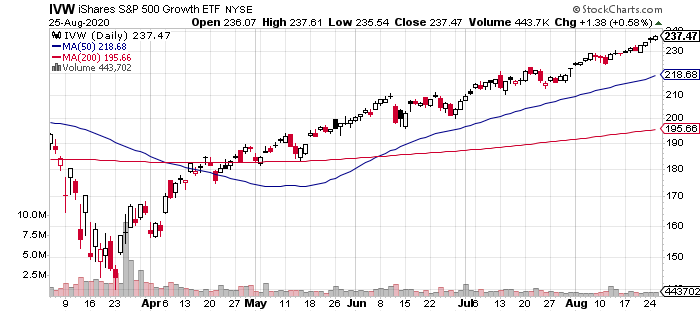
The strongest year-to-date run is currently held by large-cap growth stocks, based on iShares S&P 500 Growth ETF (NYSE:IVW), which is up a sizzling 23.3% so far in 2020. That’s a hefty premium over the broad market’s 8.0% gain this year via SPDR S&P 500 (NYSE:SPY). But even that sizeable advantage pales next to IVW’s bull run over some corners of the factor space.

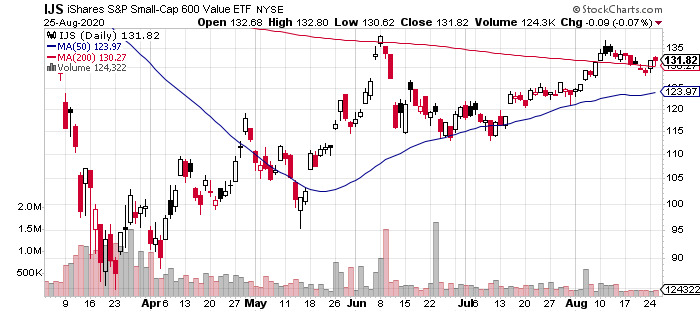
Consider this year’s return spread at the widest divergence for factor results: roughly 40 percentage points for large-cap growth stocks (IWV) less the deep year-to-date loss for small-cap values, based on iShares S&P Small-Cap 600 Value ETF (NYSE:IJS). As representatives for what’s working — and what’s not — in equity strategies in 2020, this pairing captures the outer realms of return.
While small-cap value stocks are deep in the red in relative terms vs. large-cap growth, IJR continues to show an upside bias as it recovers from the coronavirus crash in March. The bounce is uneven, particularly when measured against IVW’s stronger and near-perfect rise. But even the worst-performing slice of US equity factors is showing signs of life lately.

Overall, the majority of equity factors remain underwater on a year-to-date basis. Eight of the 12 funds on our factor list are posting losses this year.

Momentum is a strong second-place winner in 2020. The iShares MSCI USA Momentum Factor ETF is up 18.9% year to date, moderately below IVW’s leading performance.
The other two factors with positive year-to-date gains (quality and mid-cap growth) are posting relatively modest advances. Otherwise, the remainder of the equity factors field continues to struggle with red ink.
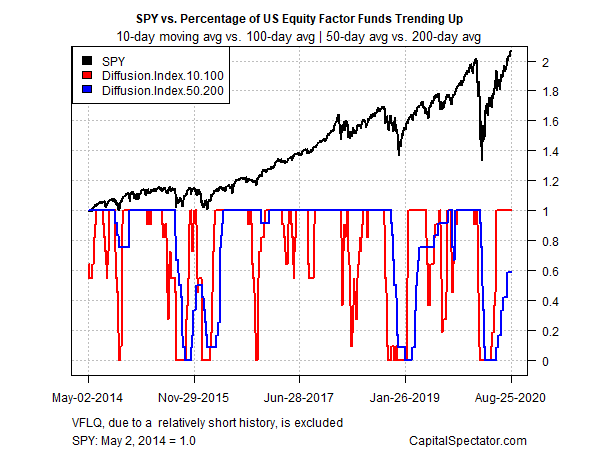
Profiling trend behavior for the factor ETFs listed above continues to reflect an ongoing rebound on a short-term basis for all the funds. By contrast, the medium-term trend is still trying to overcome the damage from the previous correction. This profile is based on two sets of moving averages. The first measure compares the 10-day average with its 100-day counterpart — a proxy for short-term trending behavior (red line in chart below). A second set of moving averages (50 and 200 days) represent an intermediate measure of the trend (blue line). While short-term momentum has rebounded sharply, the medium-term trend has yet to fully confirm the bounce.

