
The recent deceleration in US economic activity in last year’s second half is expected to spill over into 2019’s first quarter, but there are signs that the slowdown may be stabilizing. A fresh run of numbers for a broad range of indicators shows that the deterioration in the macro trend has ended, at least for now, based on analyzing the data published to date. Although it's still touching and go for deciding if the output will rebound, today’s economic profile suggests that a slower but stable pace of growth will prevail for the near term.
In contrast with last month’s analysis, The Capital Spectator’s updated profile of the US economy reveals that the recent slide in macro momentum has ended, based on projections through April. There’s still no sign that economic activity is picking up, but it’s also true that the period of weakening that began roughly a year ago is showing signs of steadying.
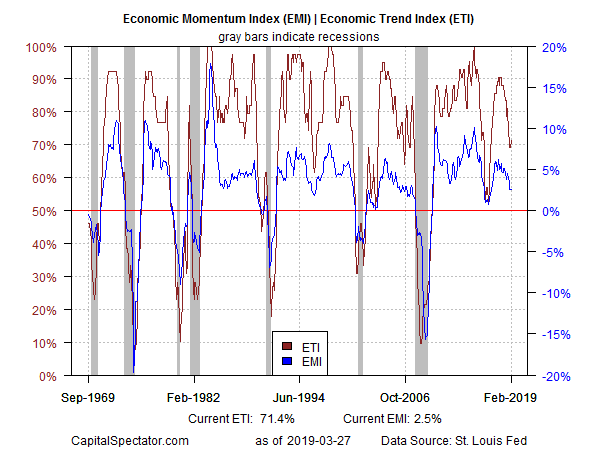
Notably, the Economic Trend Index (ETI) – a business-cycle index that tracks 14 indicators that capture a broad snapshot of US economic activity – has been holding at roughly the 70% level in recent months (see chart below). That’s an encouraging sign after a persistent decline in ETI for much of the past 12 months. It’s premature to conclude that the slowdown has ended – much less than a re-acceleration in growth has started. But for the moment, the lull in the deceleration implies that the economy can avoid a recession in the near term by maintaining a slower but steady pace of growth.
Looking backward, there’s a higher level of confidence for concluding that there’s a low probability that an NBER-defined downturn has started, based on a diversified set of economic indicators shown in the table below. (For a more comprehensive review of the macro trend with weekly updates, see The US Business Cycle Risk Report.)
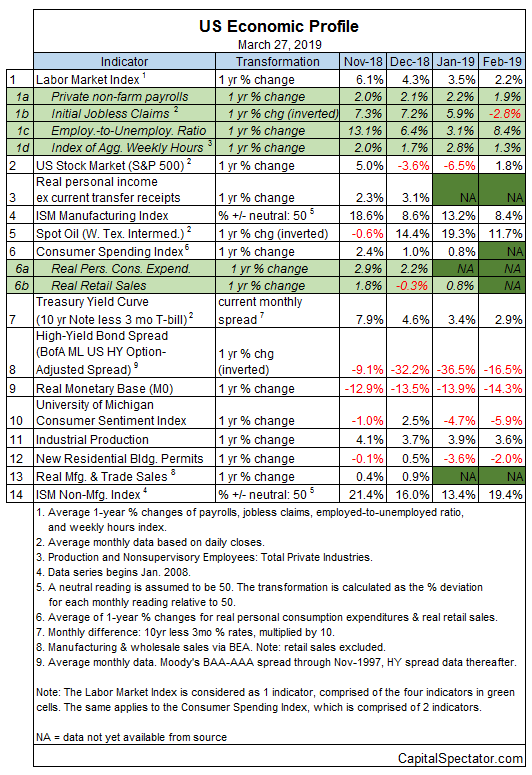
Aggregating the data in the table above continues to indicate a growth trend overall through last month, although the strength of the expansion has clearly eased relative to recent history. But in today’s update, ETI ticked up in February to 71.4% (readings below 50% indicate economic contraction). Meantime, the Economic Momentum Index (EMI), another business cycle benchmark based on the 14 indicators above, held steady last month at 2.5%, which is moderately above the benchmark’s 0% tipping point.
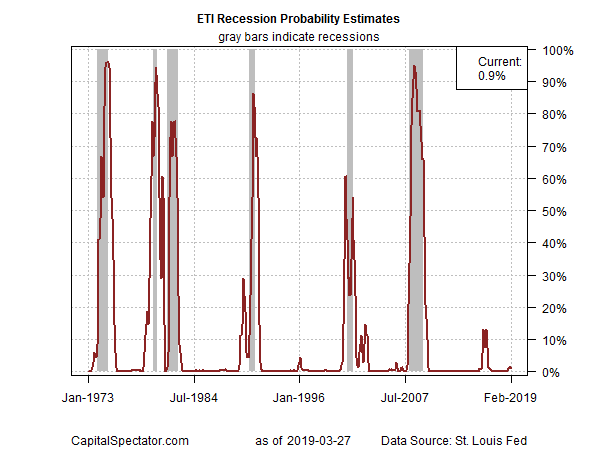
Translating ETI’s historical values into recession-risk probabilities via a probit model points to low business-cycle risk for the US through last month. Analyzing the data through this lens indicates that the odds remain virtually nil — roughly 1% — that NBER will declare February as the start of a new recession.
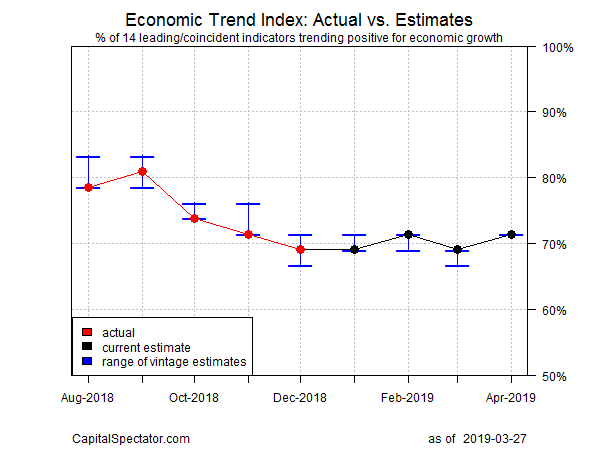
For the near-term outlook, consider how ETI may evolve as new data is published. One way to project values for this index is with an econometric technique known as an autoregressive integrated moving average (ARIMA) model, based on default calculations via the “forecast” package in R. The ARIMA model calculates the missing data points for each indicator for each month — in this case through April 2019. (Note that December 2018 is currently the latest month with a complete set of published data for ETI.) Based on today’s projections, ETI is expected to remain mostly steady and comfortably above its danger zone through next month.
Forecasts are always suspect, but recent projections of ETI for the near-term future have proven to be reliable guesstimates vs. the full set of published numbers that followed. That’s not surprising, given ETI’s design to capture the broad trend based across multiple indicators. Predicting individual components in isolation, by contrast, is subject to greater uncertainty. The assumption here is that while anyone forecast for a given indicator will likely be wrong, the errors may cancel out to some degree by aggregating a broad set of predictions. That’s a reasonable view, based on the generally accurate historical record for the ETI forecasts in recent years.
The current projections (the four black dots in the chart above) suggest that the economy will continue to expand in the immediate future. The chart also shows the range of vintage ETI projections published on these pages in previous months (blue bars), which you can compare with the actual data (red dots) that followed, based on current numbers.